Recycling isn’t as simple as it sounds. We’ve been curious how effective it really is and we wanted to understand the impact of recycling today. In a world where information is noisy but not always reliable, this is a comprehensive list of 50 statistics on recycling plastic, aluminum, glass, paper, and e-waste. All stats are sourced and as recent as possible.
Plastic
We’ll start with plastic because its stats are baffling and disappointing. Don’t worry – plenty more positive stats come later!
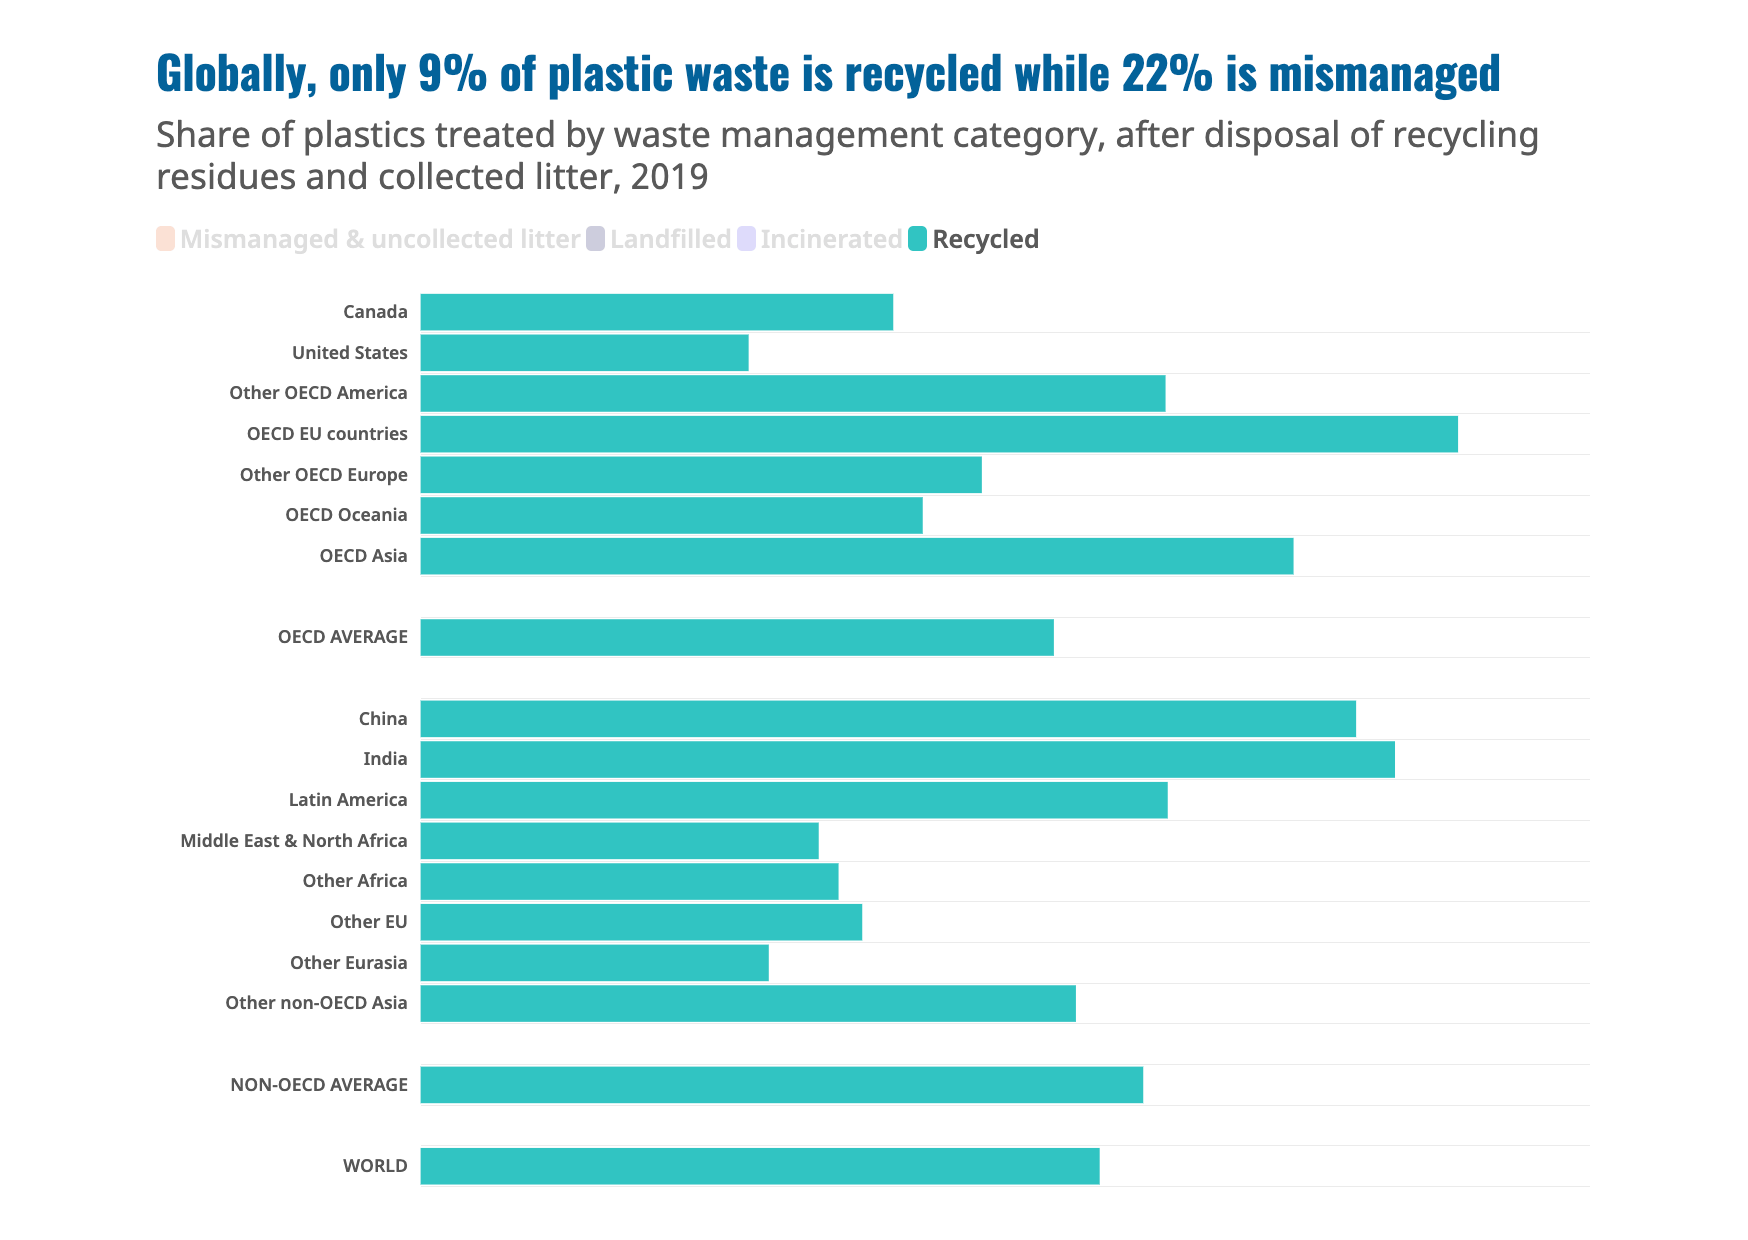
1. 91% of the world’s plastic waste is not recycled. For the entire plastics lifecycle in 2019, only 9% of plastic waste was recycled, 19% was incinerated, almost 50% went to sanitary landfills, and the remaining 22% was mismanaged (disposed of in uncontrolled dumpsites, burned in open pits, or leaked to the environment). (OECD, 2022)
2. In a business-as-usual scenario (without further interventions), the amount of mismanaged plastic waste would almost double, from 2019 to 2040. Meanwhile, the predicted global plastic recycling rate for 2040 is the same: less than 10%. (Nordic Council of Ministers and Systemiq, 2023)
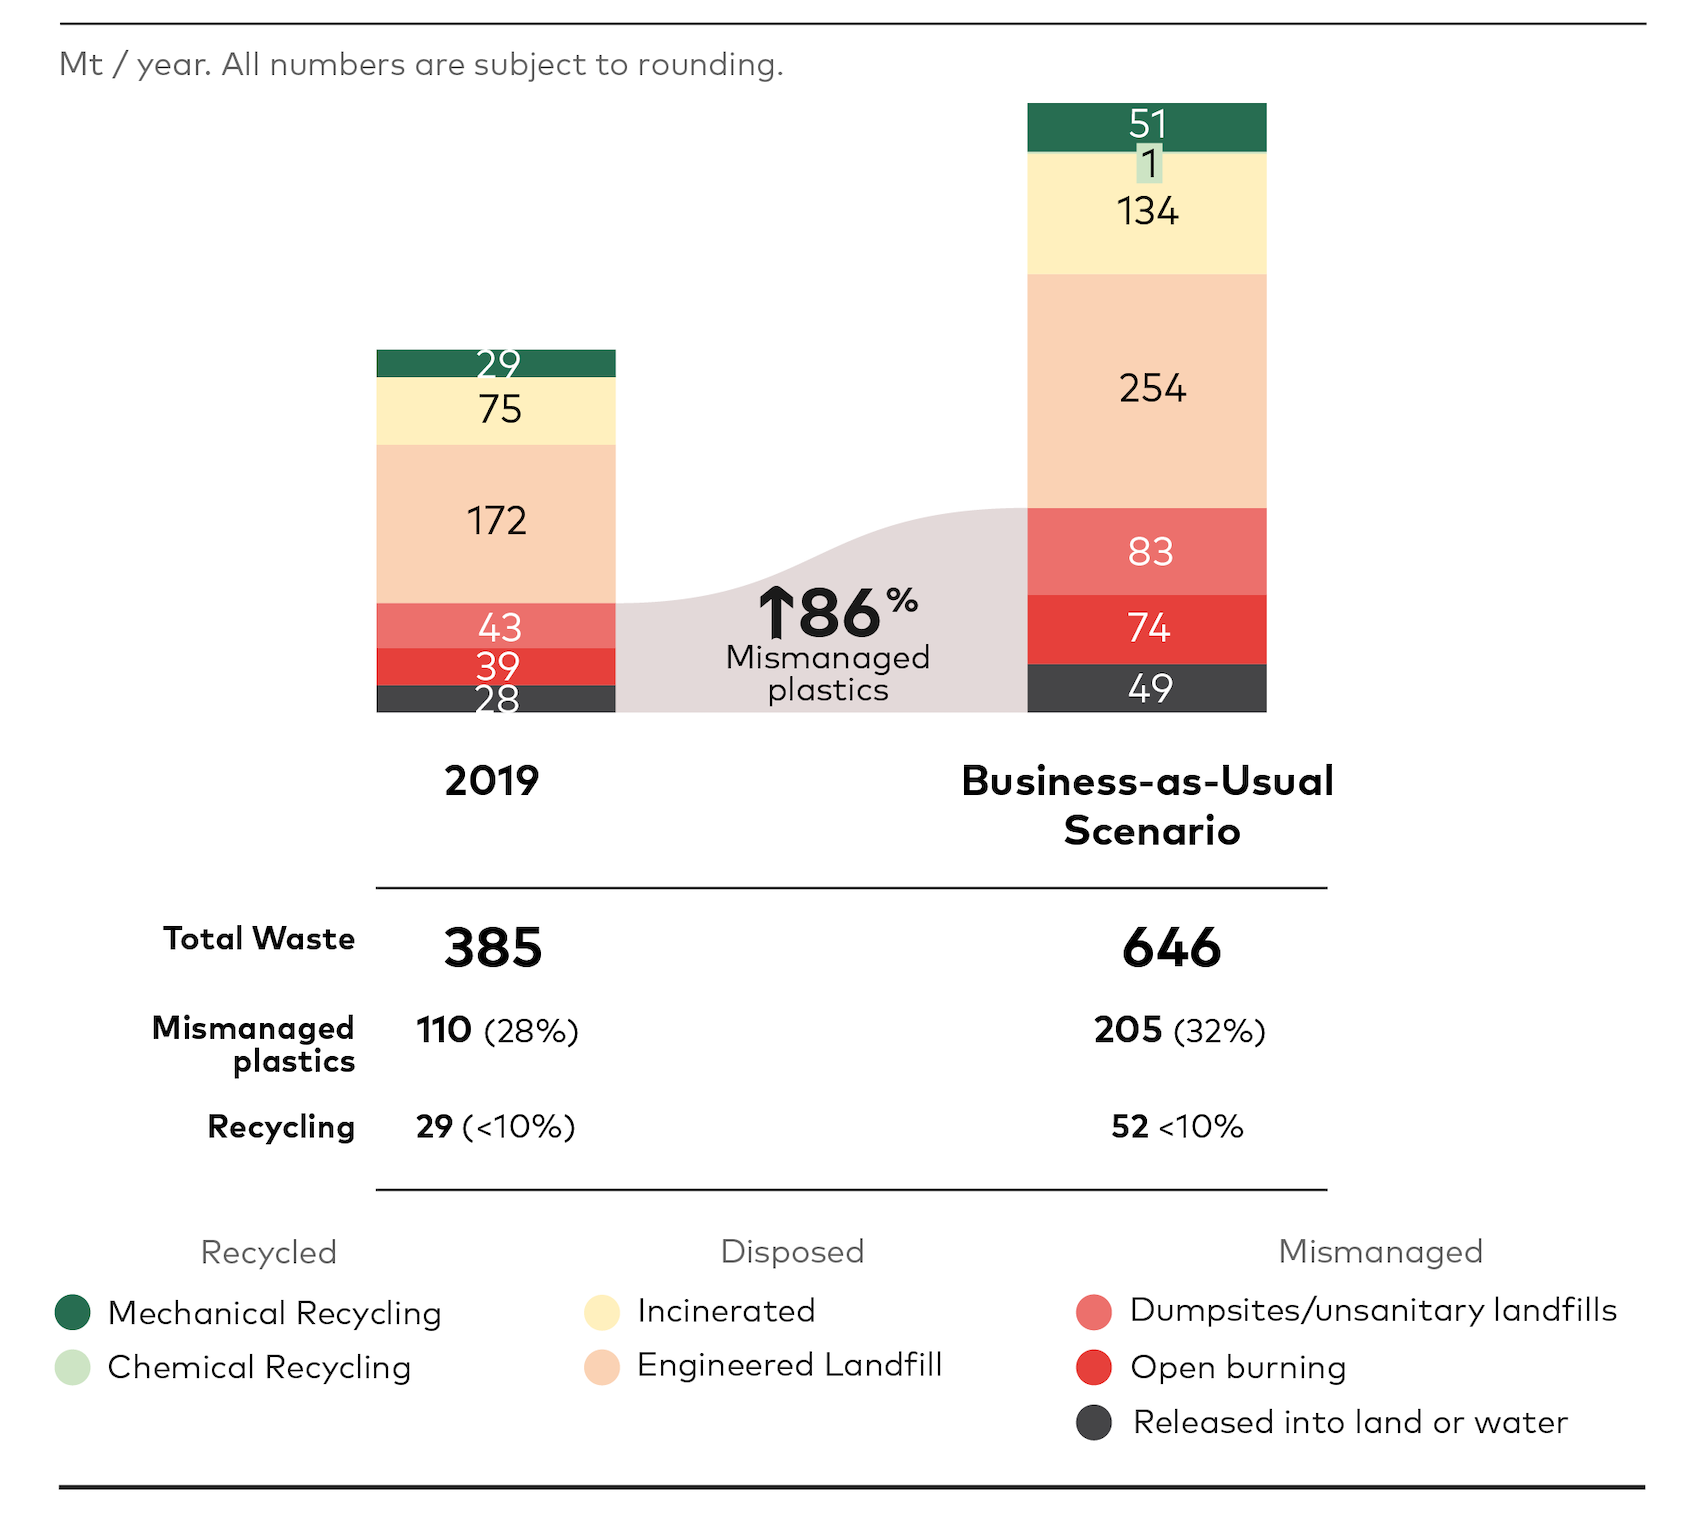
3. In contrast to the business-as-usual scenario from the same report, if far-reaching global policies across the lifestyle of plastic were adopted, we could see 43% of the world’s plastic waste recycled in 2040. (Nordic Council of Ministers and Systemiq, 2023)
4. Although many plastics are recyclable, producing new plastic products is often cheaper than recycling and reusing existing materials. (Hou et al., 2021)
5. Of all the plastic waste generated on earth (1950 – 2015), only 9% was recycled. 12% was incinerated and 79% was accumulated in landfills or the natural environment. Global plastic recycling rates have yet to reach two digits in 2024. (Science Advances, 2017)
6. Meanwhile, global plastic consumption has quadrupled over the past 30 years. (OECD, 2022)
7. Despite decent progress on plastic recycling rates since 2000, most reports reveal that plastic recycling rates in some (but not all) parts of the world have plateaued in recent years. (CleanHub, 2024 and CESifo, 2024)
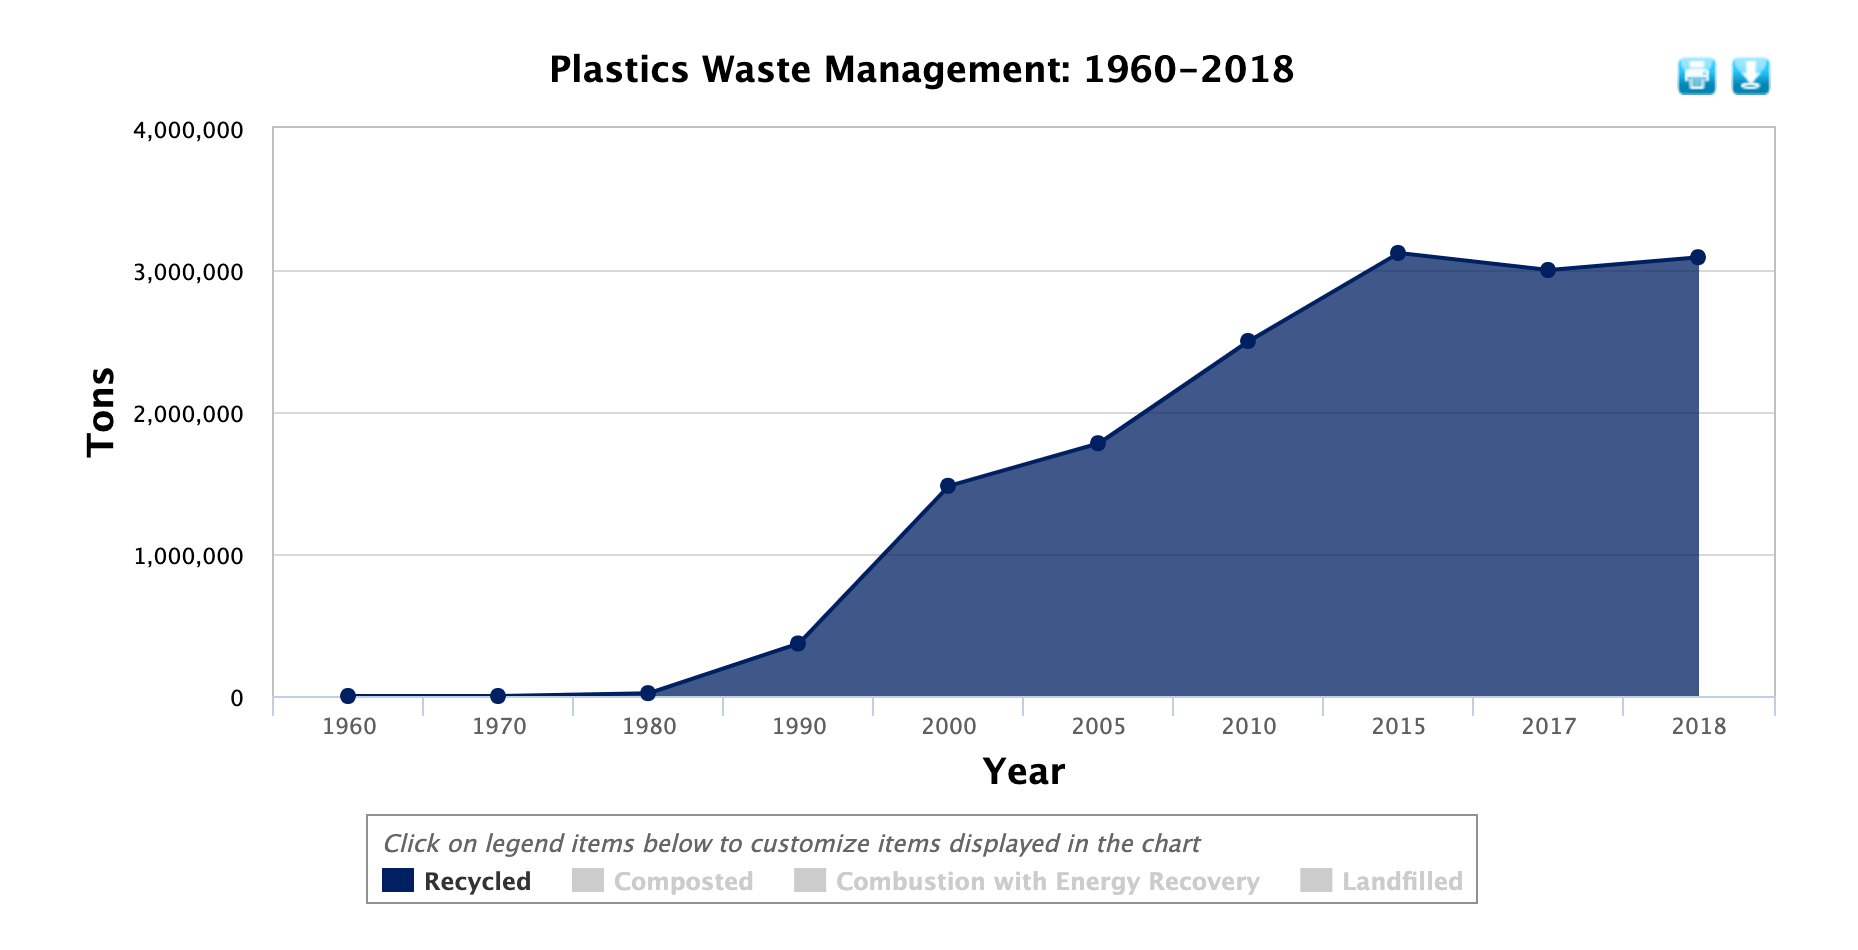
8. The U.S. has a plastic recycling rate of 5% – the worst of all developed countries regarding plastic recycling – which dropped from 2018’s 8.7% rate when imports to China were still accepted and counted as recycled (Greenpeace, 2022). Meanwhile, the U.S. is one of the major plastic producers and in 2016, generated more plastic waste than any other nation in the world – also per capita (NAP, 2020).
9. The U.S. burned about 6 times more plastic waste than it recycled in 2016. And it was predicted to be the same, if not more, in 2018. (Jan Dell, 2019)
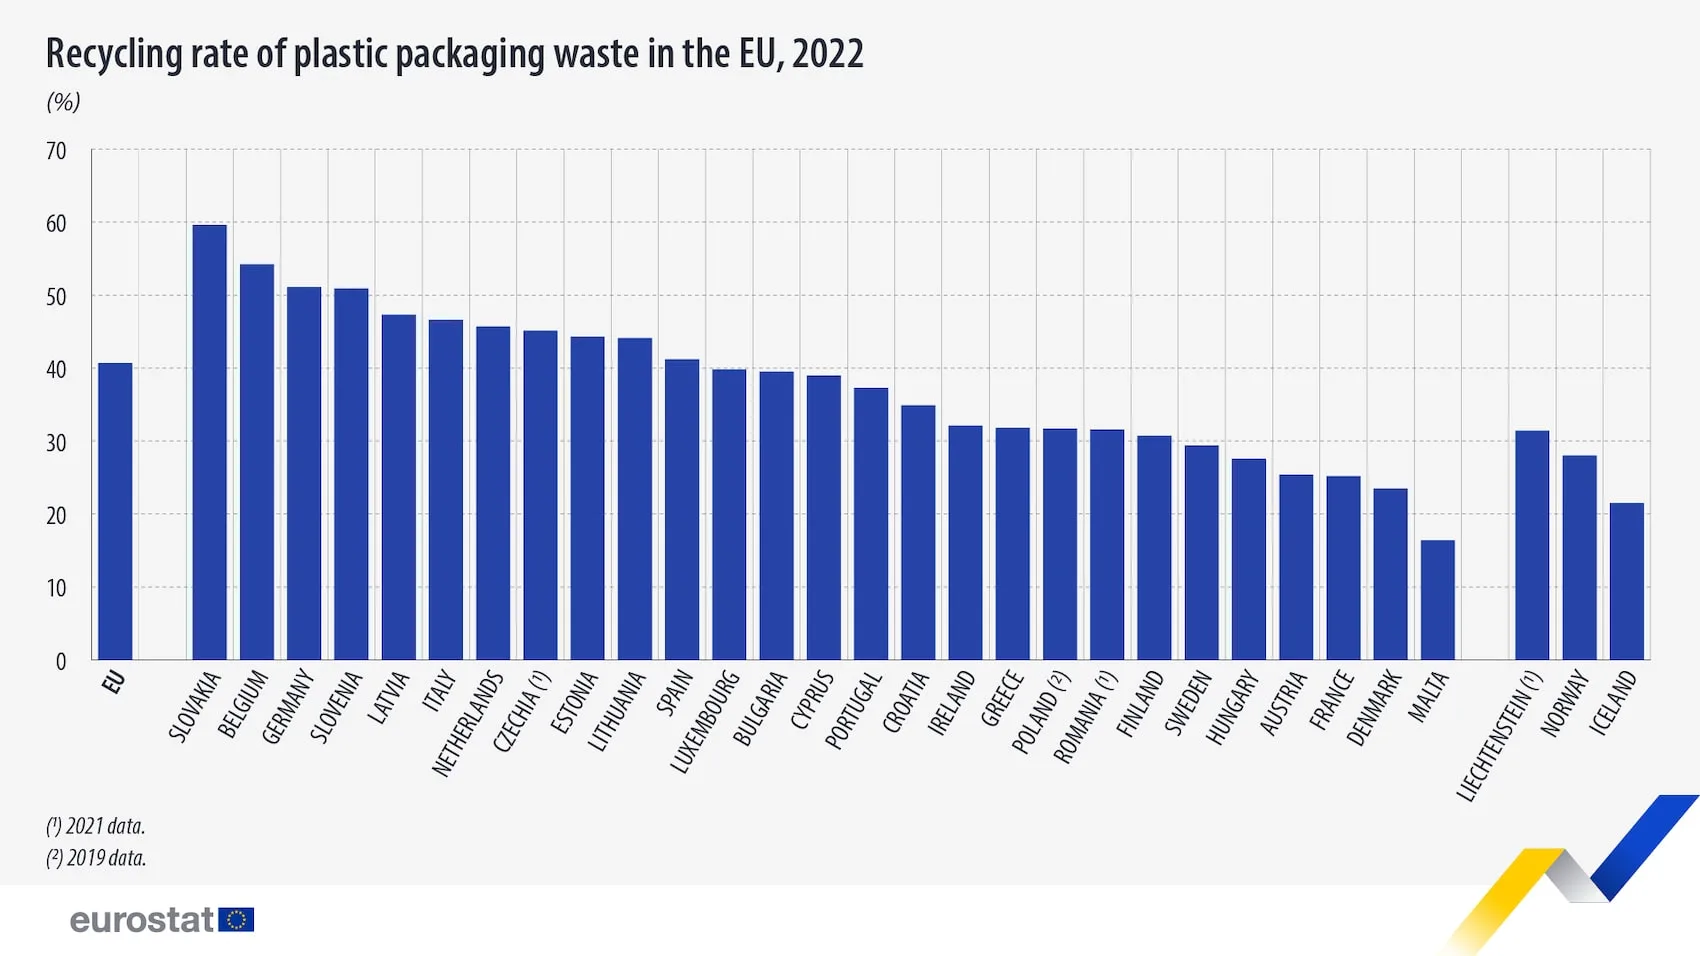
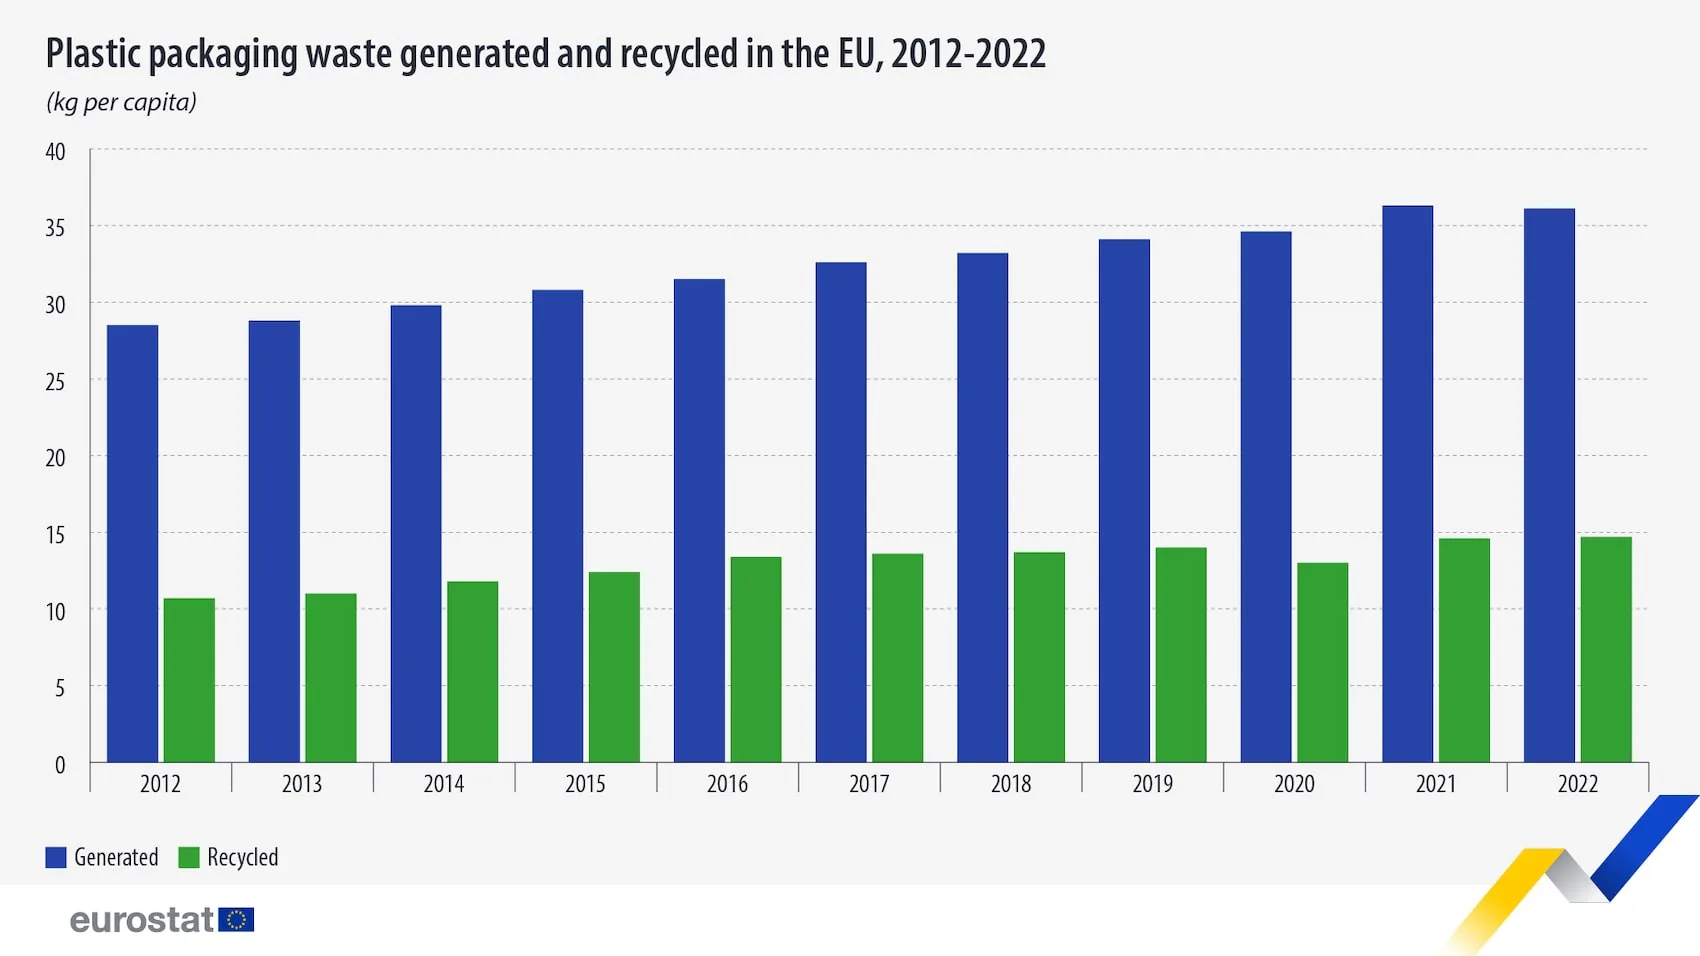
10. The EU recycled 41% of all plastic packaging waste generated in 2022, a decent increase from 2012’s 38%. (Eurostat, 2024)
11. The EU’s increase in the recycling rate of plastic packaging waste is notable considering the even larger increase in the rate of plastic packaging waste generated. (Eurostat, 2024)
12. Europe had a 60% PET collection rate in 2022, out of which 10% was contaminated. So 54% of all PET waste in Europe was sorted for recycling in 2022. (UNESDA, 2022)
13. Almost 50% of the recycled PET went into bottle production, resulting in a 24% average recycled content rate for plastic beverage bottles across Europe in 2022. Due to PET’s high recyclability and availability, collection rates should be higher. (UNESDA, 2022)
14. PET recycling can reduce energy consumption by 84% and GHG emissions by 71% compared to virgin PET production, but they can vary depending on the recycling process. (ScienceDirect, 2024)
15. In the film Plastic Wars, FRONTLINE and NPR claim that plastic makers knew there was no economically viable way to recycle most plastics since 1974 and still publicly promoted recycling. (Plastic Wars, 2020)
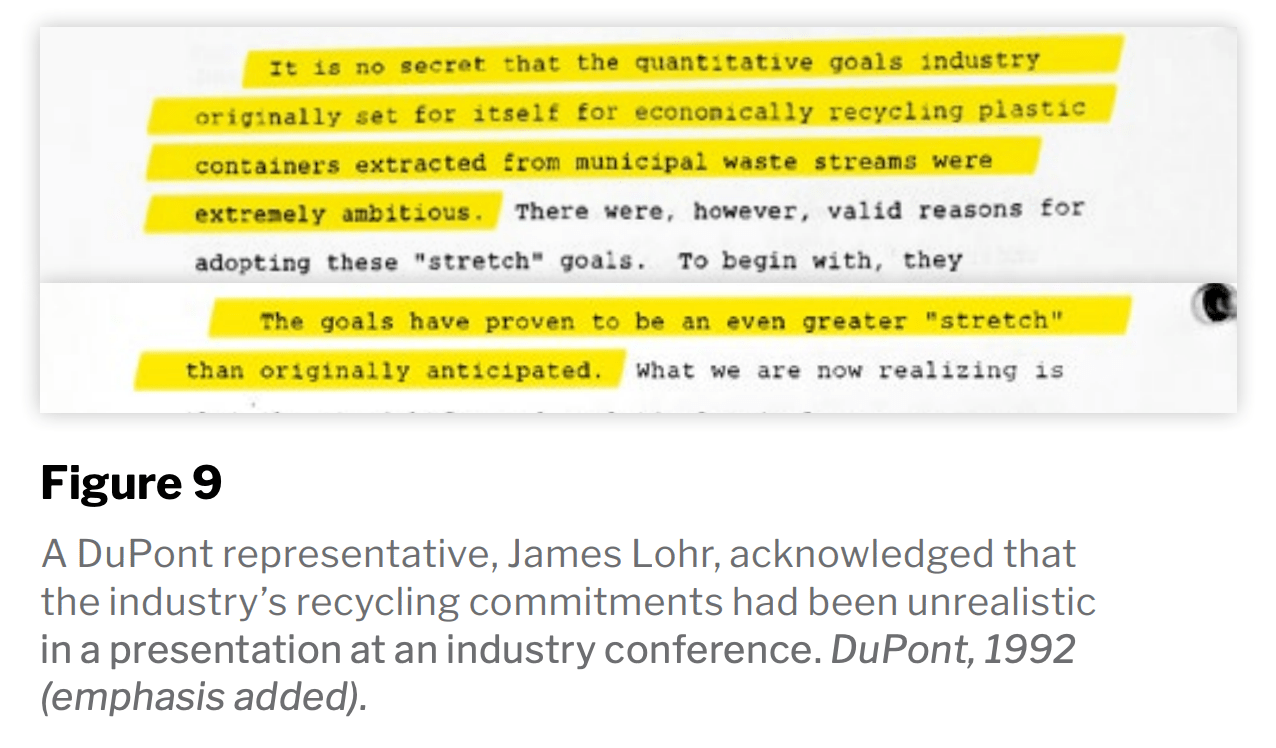
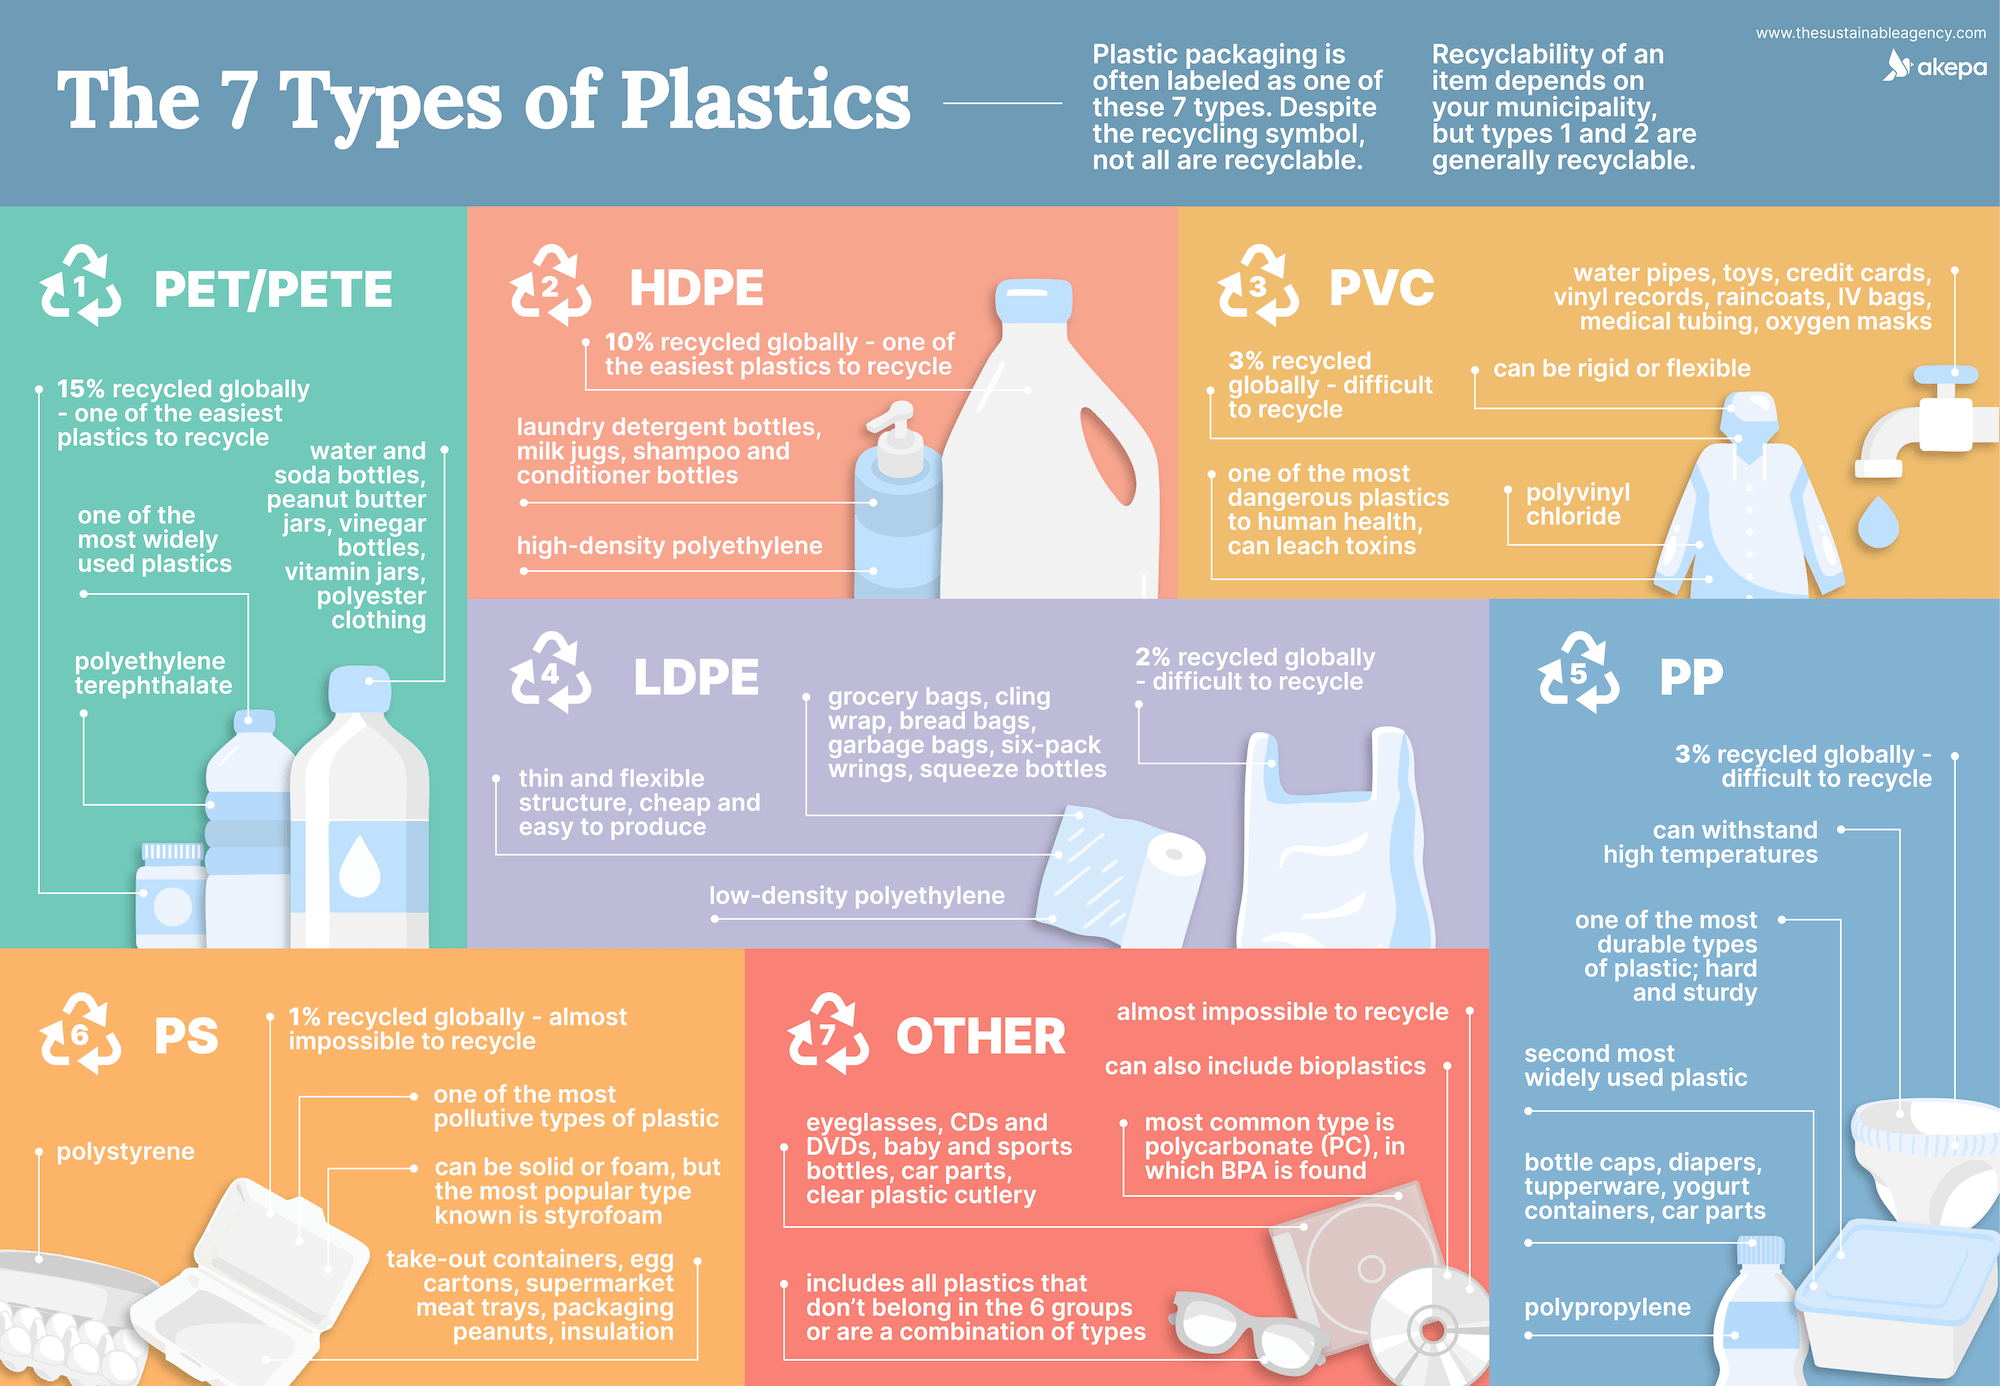
16. As a result of the environmental backlash and legal threats they faced in the 1980s, it’s argued that the plastics industry began a campaign to sell the promise of plastic recycling. Strategies included the ubiquitous yet overpromising recycling symbols with numbers inside. (Center for Climate Integrity, 2024)
Aluminum
Now that we’ve got through plastic, we can take a deep sigh and move on to other materials, whose stats are much lighter in comparison. Materials like aluminum, paper, and glass are easily recyclable and have much higher recycling rates than plastic.
17. 75% of all aluminum ever produced globally is still in use today. (International Aluminium Institute, 2025)
18. Aluminum is infinitely recyclable and is one of the most recycled materials. (IAI, n.d.)
19. Recycled aluminum saves 94% of the carbon and 93% of the energy needed to make new aluminum. (The Aluminum Association, 2022)
20. From 1991 to 2016, the carbon footprint of recycled aluminum production in North America dropped by 60%, and the energy needed to produce recycled aluminum dropped by 49%. (The Aluminum Association, 2022)
Glass
21. Glass can be recycled infinitely without any loss in quality. (Glass Packaging Institute, n.d.)
22. In 2021, the EU had a 75.6% recycling rate of glass packaging. (Statista, 2024)
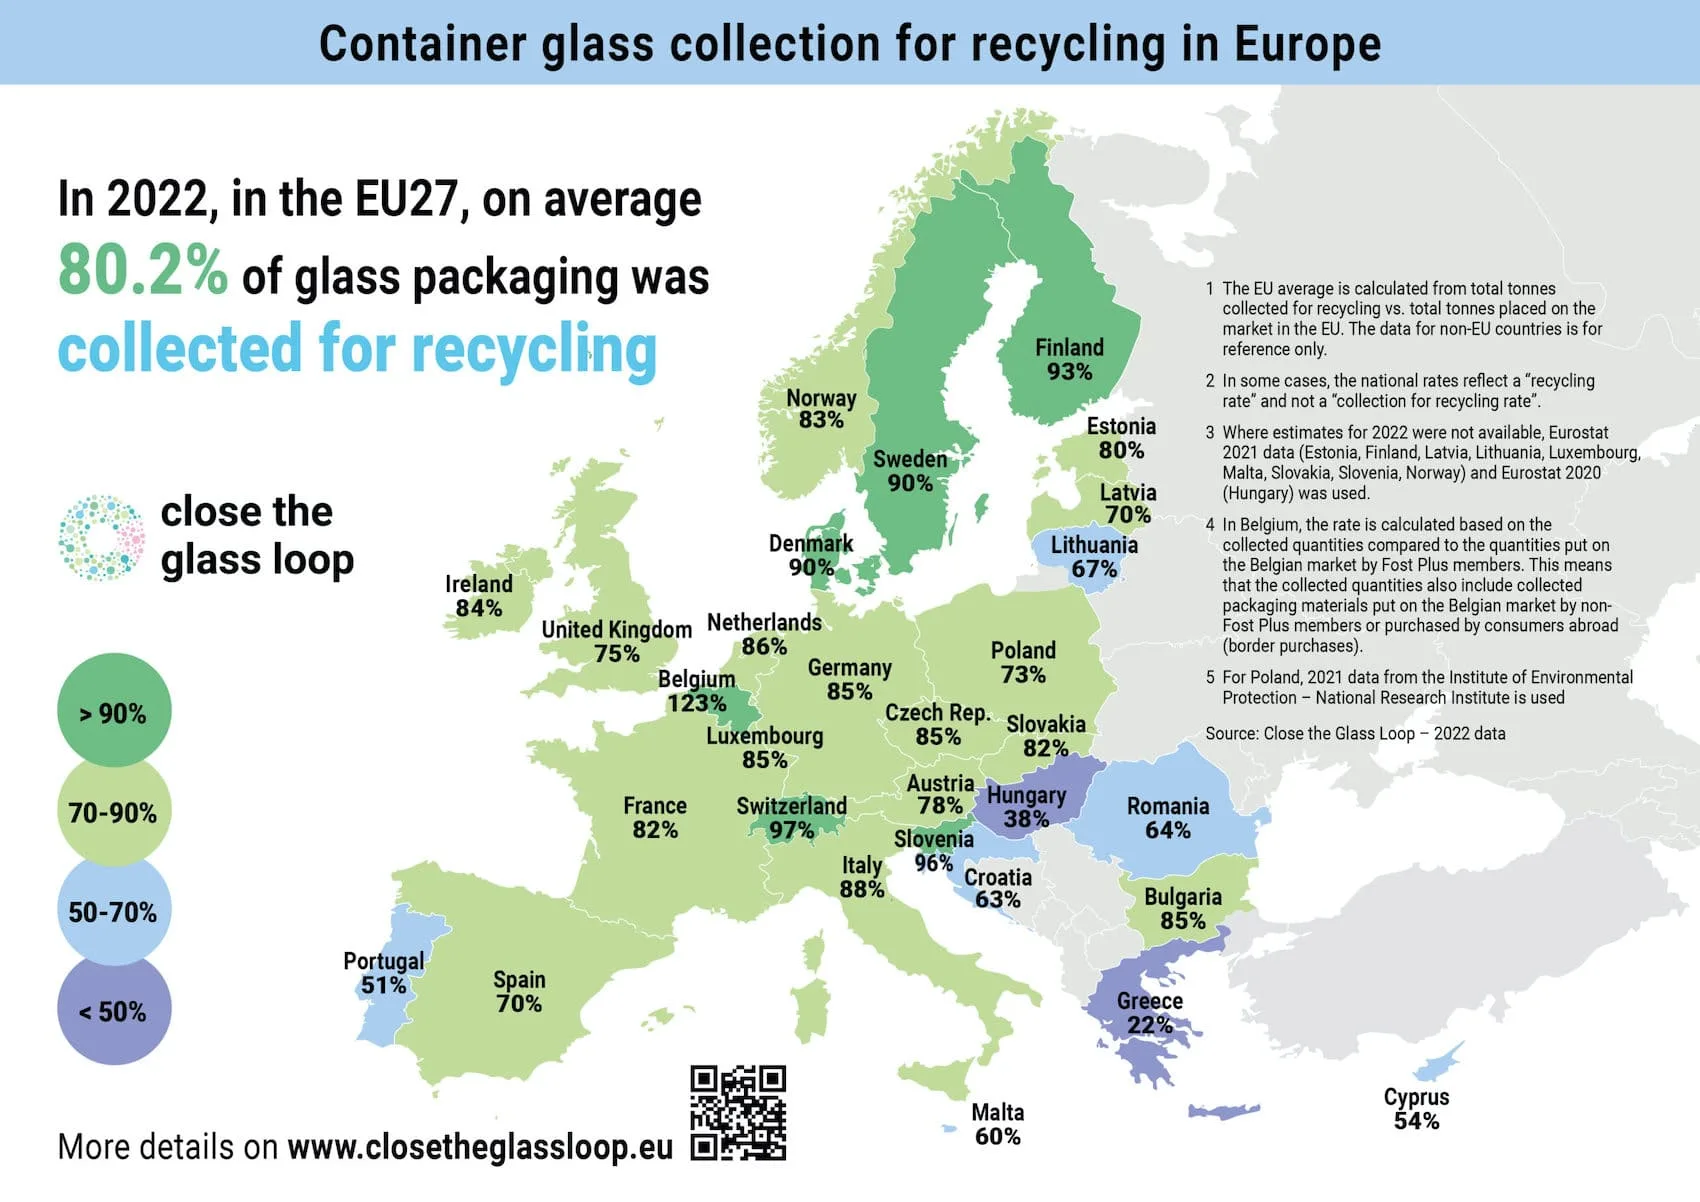
23. The EU’s average glass packaging collection rate in 2022 was 80.2%. (Close the Glass Loop, 2024) This means that a lot of people are sorting glass for recycling in the EU – which is important because if a glass bottle ends up in the landfill, it could take up to one million years to degrade. (seattlepi.com, n.d.)
24. Only 21% of glass is recycled globally. (MMR, 2024)
25. Still, as of 2018, the global recycling rate for glass is just 21%. (Statista, 2023)
26. Plastic presents unique barriers to recycling that other materials like glass, aluminum, and paper do not, such as difficulties in collection and sorting, danger of toxins, and the lack of profitability. (Greenpeace, 2022)
Paper
27. An estimated 2 to 13 liters of water is used per A4 sheet of paper. (Water Footprint Network, 2010) But other sources report that an average of 10 liters are used per A4 sheet of paper, in some cases going up to 20 liters. (Environmental Paper Network, 2018)
28. Every ton of recycled paper saves 30,000 liters of water and 17 trees. (Environmental Studies Institute, 2006)
29. Producing recycled paper requires 28-70% less energy consumption than virgin paper. (Environmental Studies Institute, 2006)
30. The recycling rate of paper and cardboard packaging in the EU has remained above 80% since 2008 up until 2022 (last year recorded). (Statista, 2024)
31. Paper and cardboard packaging had the highest recycling rate out of all packaging waste in the EU in 2022, at 83.2% – followed by metallic (75%), glass (75%), and plastic (41%). (Statista, 2024)
32. In terms of all paper (and not just packaging), in 2023 the recycling rate for all paper products in Europe reached the record high of 79.3%. (EPRC, 2024)
33. The average global paper recycling rate is 59.9%, checked in 2021. (Cepi, 2023)
34. Research shows that paper fiber can be recycled 25 times with high quality, significantly more than previous estimates of 4 to 7 times. (Pro Carton, 2021)
E-waste
35. E-waste is currently the fastest growing waste stream in the world, with an annual growth rate of 3-4%. (ScienceDirect, 2021)
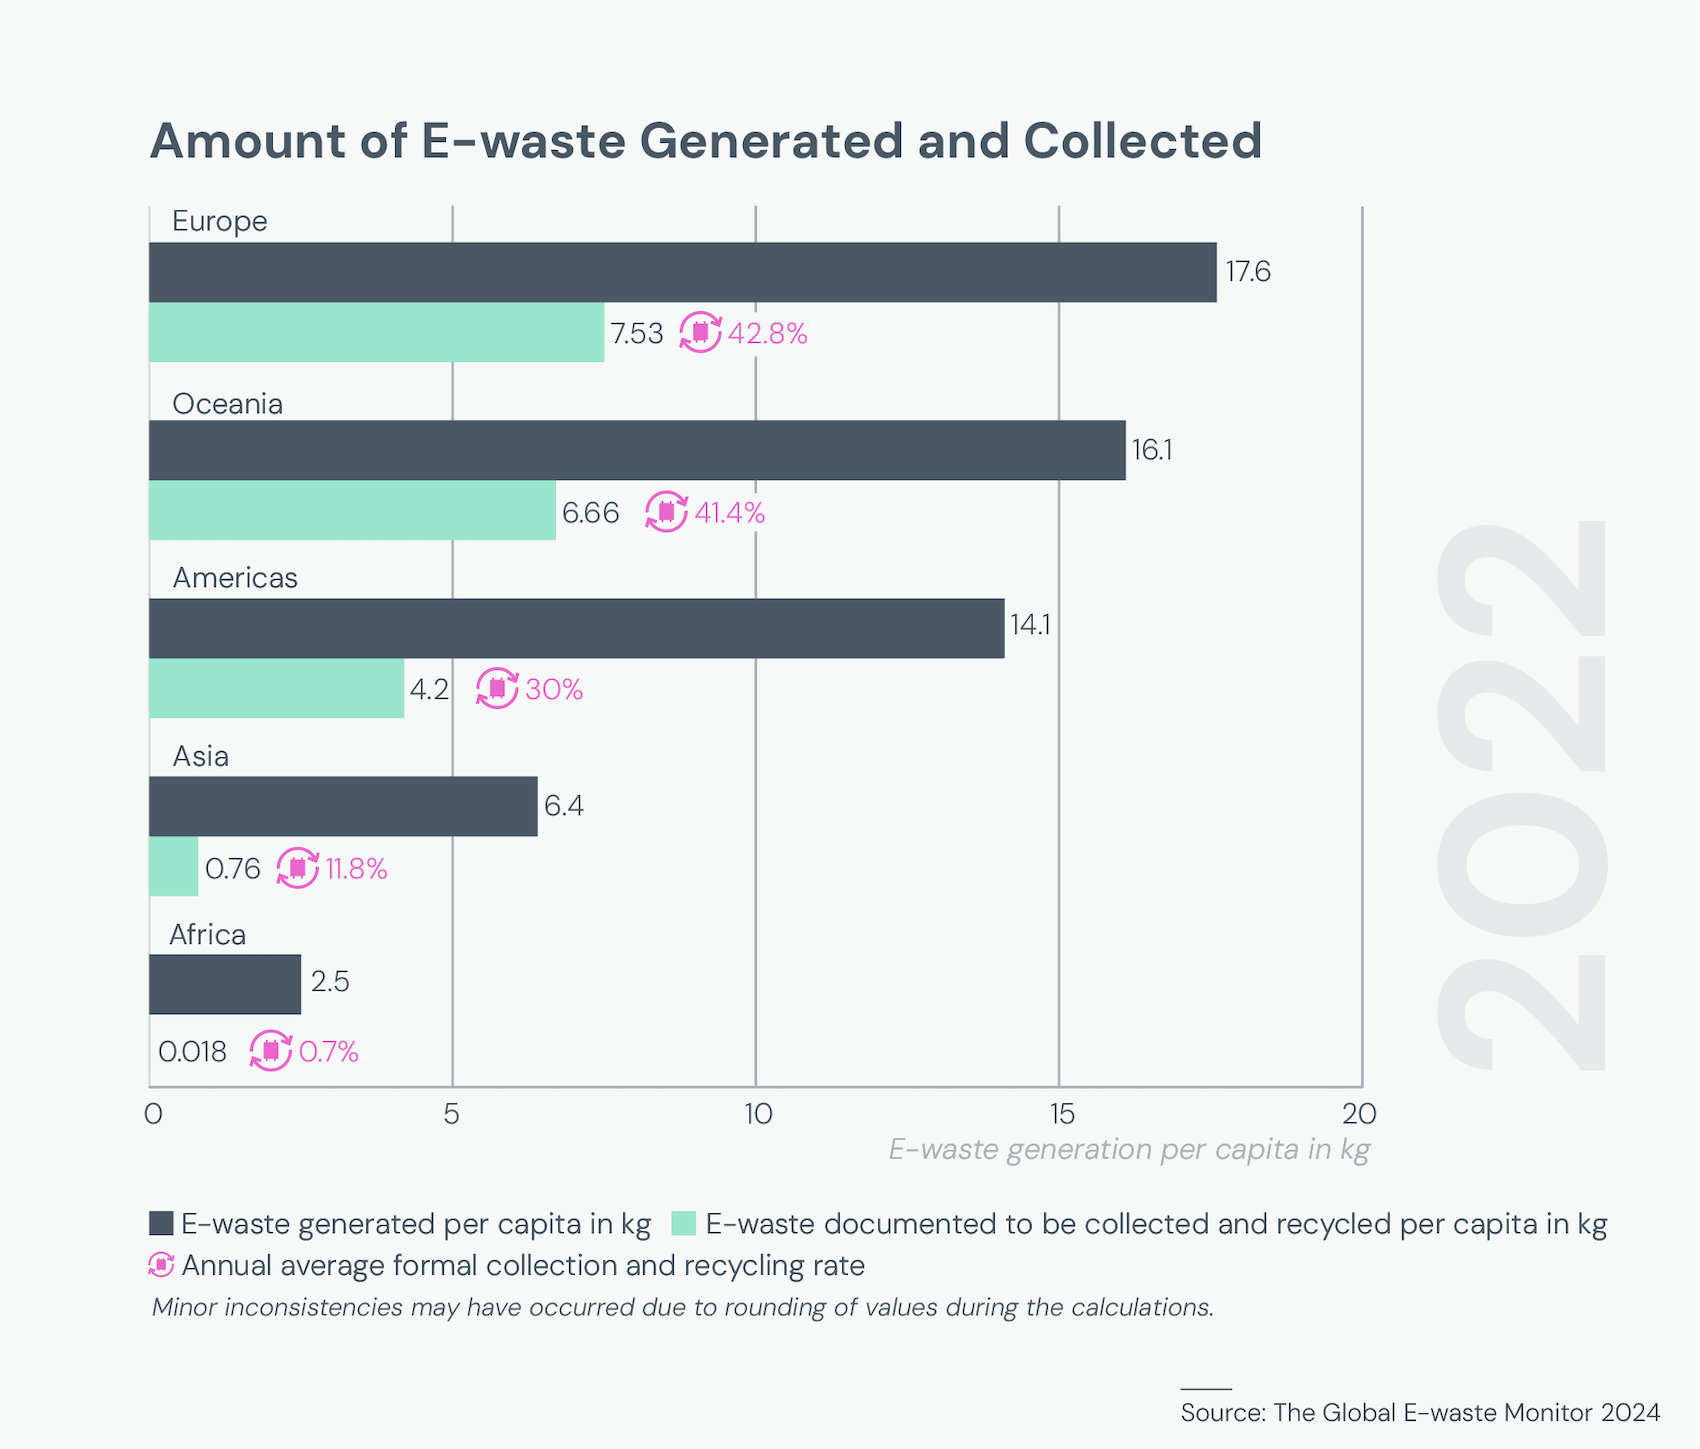
36. In 2022, only 22.3% of e-waste was recycled globally. The rest is dumped, traded, or recycled under poor conditions, releasing toxic chemicals like lead and mercury. (UN, 2024)
38. Just 1% of rare earth element demand is currently met by e-waste recycling. (UN, 2024)
Overall facts & stats on recycling
39. Only 7.2% of raw materials consumed in 2023 were recycled. (Circularity Gap Report, 2023)
40. Global circularity is in decline, despite a growing interest. The share of global secondary materials has decreased by 21% over 5 years, from 2018 to 2023, as the vast majority of materials entering the economy are virgin. (Circularity Gap Report, 2024)
41. Around 40% of waste is recycled in the EU. But recycling rates vary considerably by country, with some above 60% and some below 20%. Figures like this are to be taken with a pinch of salt, as it is difficult to measure how much waste gets recycled accurately. (EEA, 2024)
42. When Donald Sanderson, “the father of recycling”, introduced curbside recycling in the U.S. in 1980, it wasn’t well-received and people dumped trash in his yard in opposition.
43. Steel is the most recycled material in the world. (worldsteel, n.d.)
44. Only 21% of residential recyclable materials in the U.S. are being recycled. 76% is lost to trash at the household level and not collected for recycling. (The Recycling Partnership, 2024)
Recycling behaviors and perspectives
45. In a survey of more than 5,000 European consumers (from the UK, France, Germany, Spain, and Italy) it was found that 58% of people place recycling at the top of the list to reduce impacts of climate change. (Pro Carton, 2023)
46. 54% of European consumers chose a brand specifically for the packaging used during 2022. (Pro Carton, 2023)
47. 86% of European consumers believe that ‘easy to recycle’ is the most important packaging feature. (Pro Carton, 2023)
48. 31% of people around the world are not confident that what they put in the recycling bin is actually getting recycled. (Shelton Group, 2024)
49. In a survey of 965 people living in the U.S. in 2024, it was found that 87% of people recycle at home and ¾ of people want the U.S. government to make recycling more accessible. (CleanHub, 2024)
50. One-third of Americans find it impossible to avoid single-use plastics. (CleanHub, 2024)
51. 31% of Americans felt that access to facilities is the biggest barrier to recycling. The U.S. doesn’t have a national law mandating recycling so waste management could come as an additional cost. 27% of people felt that motivation was the biggest barrier. (CleanHub, 2024)
52. In a joint global survey, it was found that in developed regions like North America and Western Europe, the top barriers to recycling were either inconvenience or a lack of trust in recycling programs. While in regions like the Middle East & North Africa, Sub-Saharan Africa and Latin America & the Caribbean, a key barrier was not knowing how to participate in recycling programs. (WEF, 2021)



Leave a Reply