
Are you feeling a little languid today? Well there’s no need for that – go out now and get some gadgets and they’ll bring some endorphins back into your life with their high-tech rizz.
It can seem like technology is the panacea for all of our collective problems. We have gizmos for everything today, cleaning the house, monitoring shady incomers, and even identifying the species of birds that visit our homes. The buzz is short-lived though; we soon tire of our fancy e-treasures, demand the finest upgrades, and even if we’re happy with our devices they are rendered prematurely obsolete by design. Adios.
Because of this ephemerality, e-waste is now the fastest growing waste stream in the world. It’s a huge problem that’s only going to get worse. We’re stuck in a vicious circle of joyride, abandon, upgrade.
Let’s get to some key stats and facts about e-waste and what it’s doing to us and our environment:
- Facts on the scale of the problem
- Facts on the impact on planet
- Facts on the impact on people
- Facts on recycling & circularity
- How big is Mt. Gizmo?
🏔 The scale & backdrop
How on earth did we get here? As technology accelerated to such a disorientating pace over the last decade, life-expectancy plummeted – for our products. Our demand for the finest iterations of smartphones, smart home devices, and so on created a torrent of formerly-adored tech.
1. E-waste is one of the fastest, if not the fastest growing solid waste-stream in the world (WHO, 2024)
2. Electronic waste is currently surging five times faster than documented recycling efforts. (Global E-waste Monitor, 2024).
3. In 2022, the world produced a record-breaking 62 million tonnes of e-waste. That averages out to 7.8 kg for every single person on Earth. The total for 2025 is projected at even higher: 65 million tonnes. (Global E-waste Monitor, 2024).
4. This mountain of tech is not dwindling – it’s growing by the millisecond. Global e-waste generation is on track to surge by another 32%, reaching 82 million tonnes by 2030. (ITU, 2024).
5. Our pockets are a huge part of the problem. Small IT and telecommunications equipment – mainly discarded mobile phones – contributed 5 million tonnes to the global e-waste stream in just one year. (Global E-waste Monitor, 2024).
6. E-waste now represents roughly 3.1% of the estimated 2 billion tonnes of total waste produced annually worldwide, up from 2.7% in 2019. (Global E-waste Monitor, 2024).
7. The global creation of e-waste is currently increasing at a rate three times faster than the growth of the world’s population (Comprehensive Medicine, 2025).
8. Geography plays a role in consumption. Asia generates the highest absolute volume of e-waste (30 million tonnes), but Europe generates the most per capita, throwing away a wasteful 17.6 kg per person annually. (Global E-waste Monitor, 2024).
9. Specifically in Europe, the latest figures suggest that around 11.6kg of yearly e-waste is collected per inhabitant. This quantity has increased a lot over the years but sadly lags behind the amount of new electronics put on the market (EEE), which has grown to 32.2kg per inhabitant per year. (European Commission, 2025).
10. To visualize the 62 million tonnes of global e-waste: it would fill 1.55 million 40-tonne trucks. If you lined those trucks up bumper-to-bumper, they would encircle the entire equator. (Global E-waste Monitor, 2024).
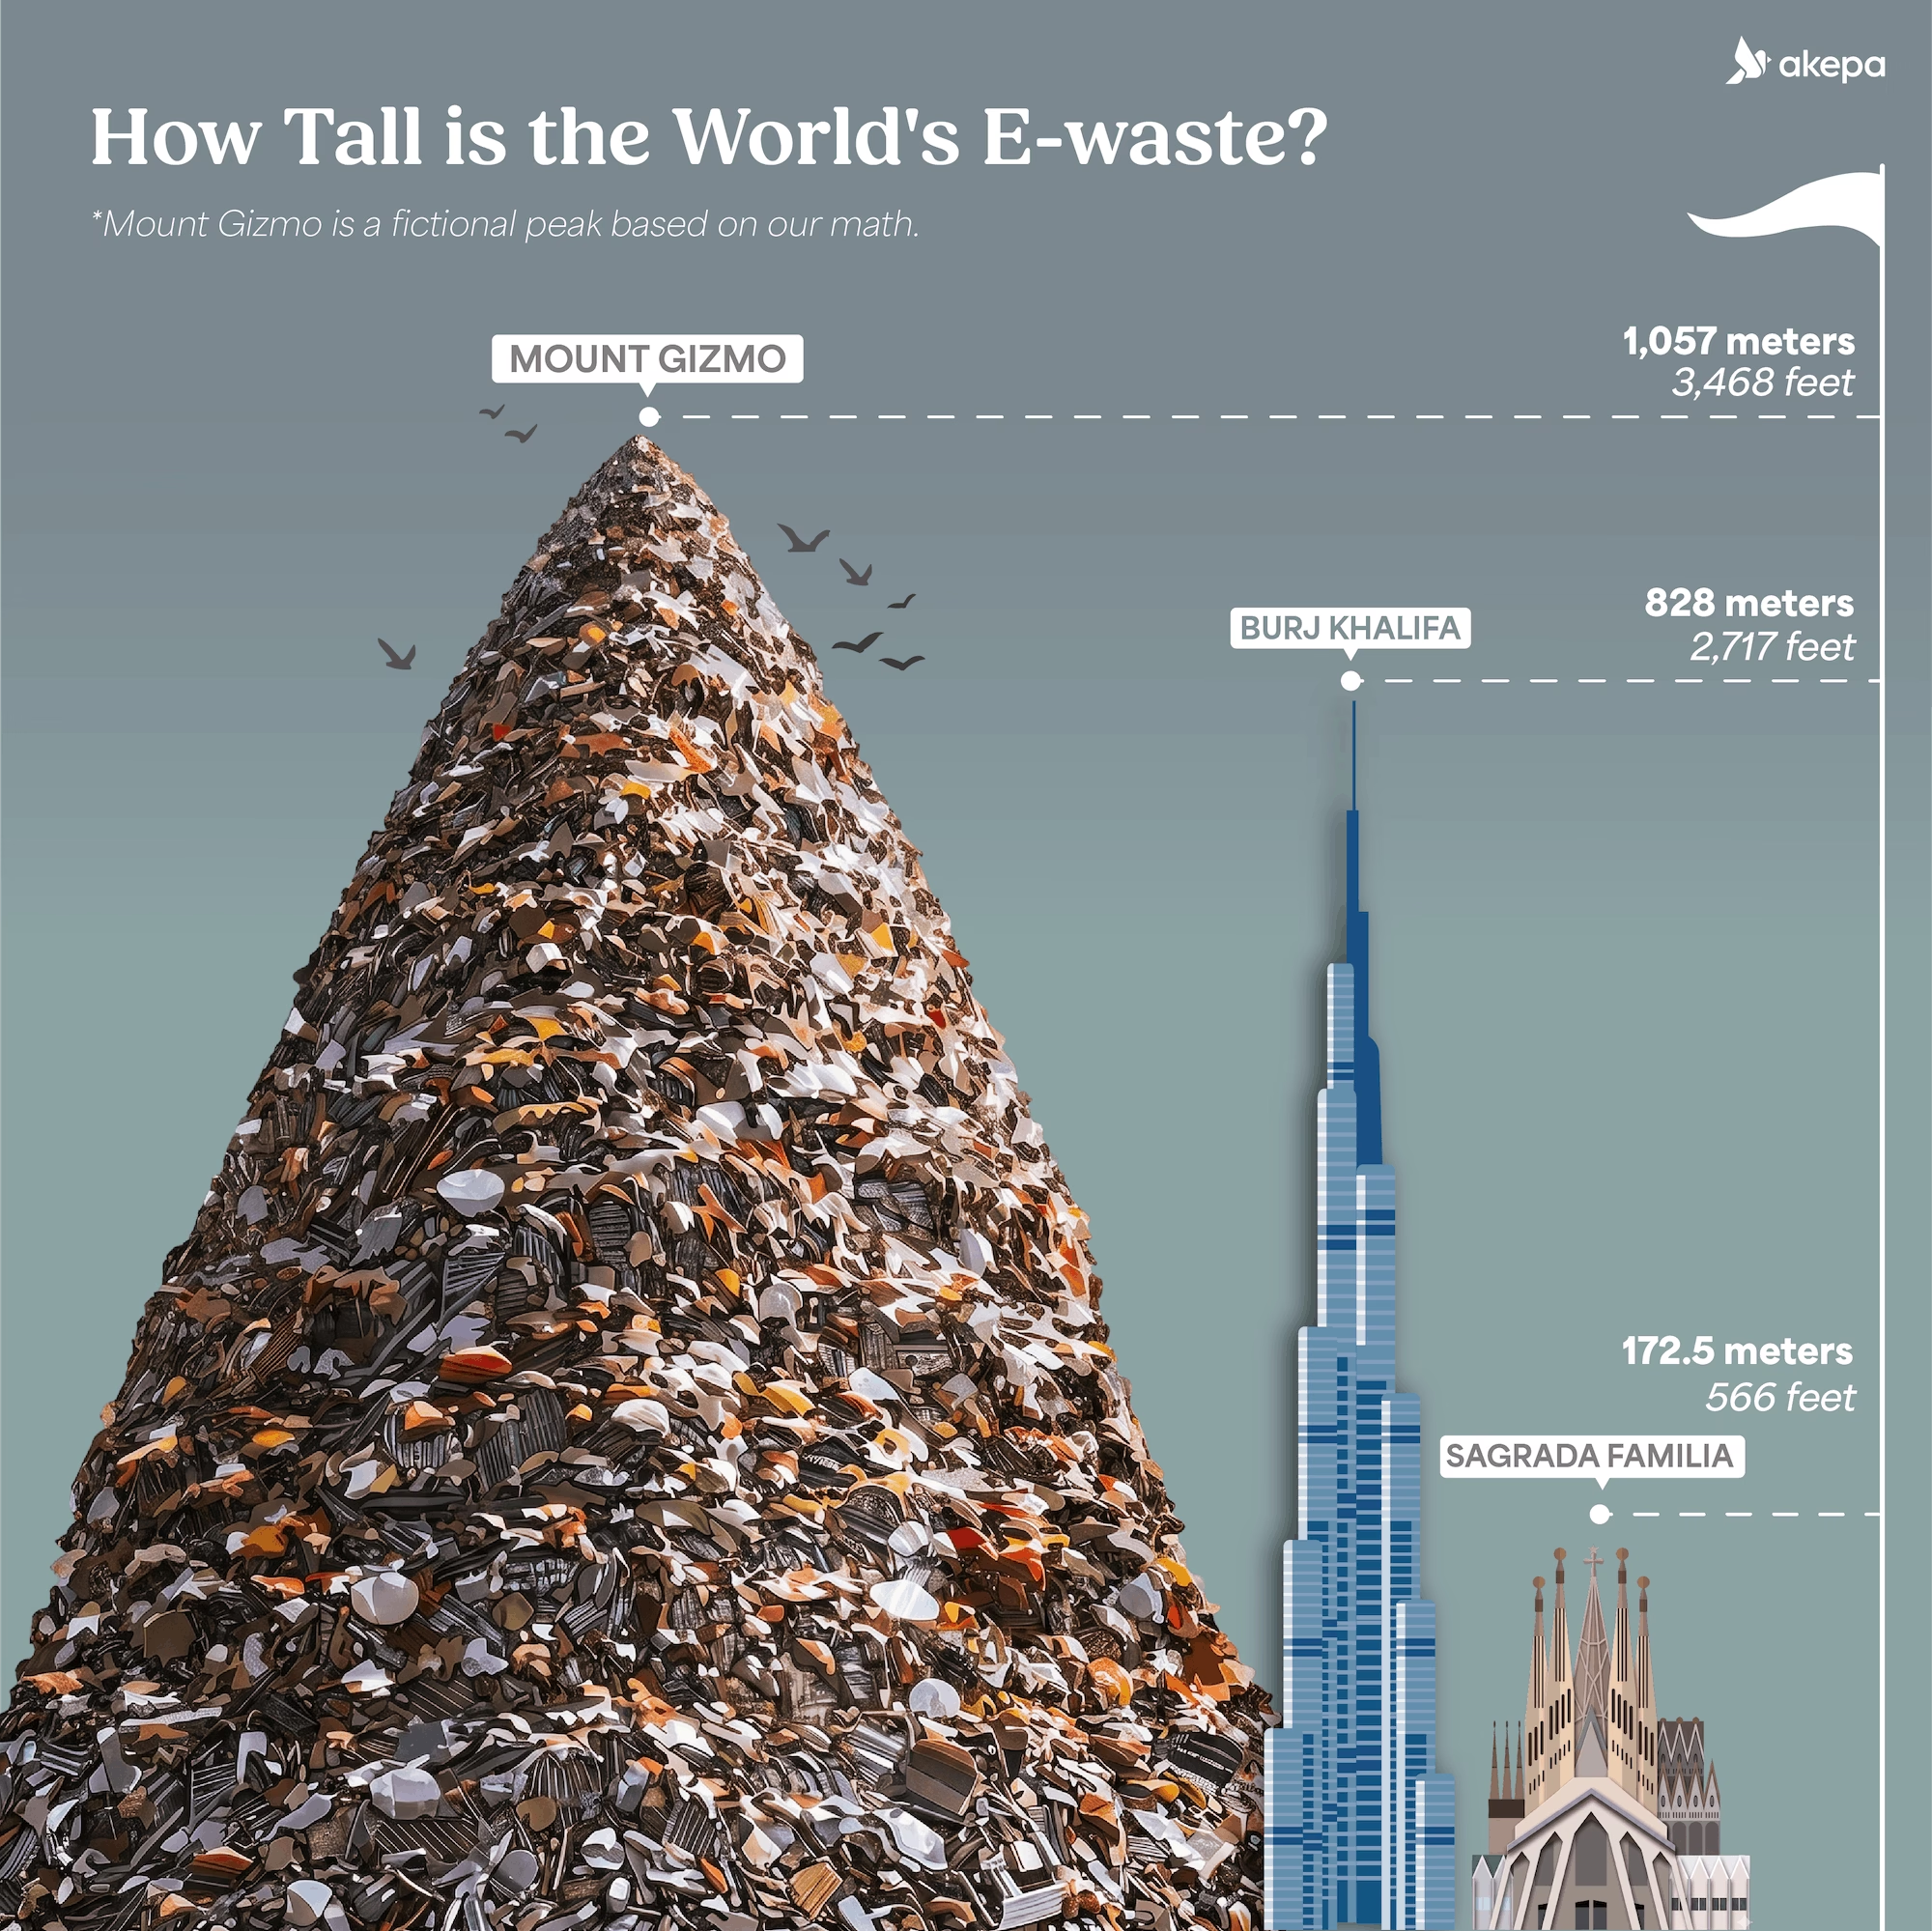
11. Or, by Akepa’s calculations, annual global e-waste would become a metallic mountain rising well above any of the world’s skyscrapers and exceed 1,000m or 3300ft – see end of post for the math.(Akepa, 2026).
🌍 Wear & tear on the planet
When gadgets die, their purgatory is a landfill where their rusty cadavers leak toxic heavy metals into our soil and water. To add to that filth, the massive emissions required to mine and build tech are leaving a scorchmark on the way we live. Let’s take a stare at the macabre environmental toll.
12. Improper e-waste management contributes to global warming. Discarded equipment that exchanges temperature (like refrigerators and AC units) released 0.19 million tonnes of CO2-equivalent emissions in 2022 due to leaking refrigerants. (Global E-waste Monitor, 2024).
13.E-waste is not something you want sitting in a landfill. The plastics in our electronics can take up to 1 million years to decompose, while aluminum and other metals take between 50 and 500 years. (ERI, 2015).
14. Even the responsible dismantling of e-waste leads to GHG emissions and those are rising. Between 2013 and 2020, the average carbon emission when dismantling a unit of e-waste increased from 1.2513 kgCO2 to 1.3335 kgCO2. This trend suggests that as devices get more complex, the energy required to break them down responsibly is rising. (Carbon Research, 2026).
15. Manufacturing our gadgets is resource-ravenous. It takes at least 240kg of fossil fuels, 22kg of chemicals, and 1.5 tonnes of water just to manufacture a single computer and its screen – more than the physical weight of a car. These totals are likely now far higher as this total is from a UN Study dating back to 2004. (UN Study, 2004).
16. When e-waste is dumped into landfills, toxins like lead and cadmium seep into the groundwater and soil. This weakens local agricultural crops, making them more susceptible to absorbing toxins, which ultimately threatens global food safety. (Microbiology Archives, 2025).
17. E-waste comprises approximately 70% of all hazardous heavy metals found in the environment, despite those toxic substances making up only 2-3% of the total material weight of the electronics themselves. (Journal of Water and Sustainability, 2026).
18. E-waste-derived contaminants are now proven to exert “multi-media and multi-pathway impacts,” heavily polluting soil, air, and dust environments with persistent organic pollutants (POPs) that actively infiltrate the biological systems of plants, animals, and human populations. (Frontiers, 2026)
👪 Human costs & bad influence
E-waste isn’t just about the environment. A crippling debt is paid by vulnerable communities forced to make fancy devices and dismantle digital trash by hand. This hidden recycling sector exposes millions – including children – to life-threatening, hazardous toxins. Here are the grim realities facing the folk at the end of the supply chain:
19. When electronics are broken down randomly, without controls, they release up to 1,000 different harmful chemical substances into the environment, including mercury, lead, and flame retardants. (WHO, 2024).
20. The human toll is devastating. According to the WHO, an estimated 16.5 million children currently work in informal e-waste disposal sites globally. Small hands are often used to dismantle tiny electronic components. (WHO, 2024).
21.The toxic cocktail of heavy metals (like lead and cadmium) and particulate matter released by burning e-waste is directly associated with severe DNA damage and decreased cardiopulmonary function in exposed populations. (International Journal of Environmental Research & Public Health, 2022).
22. The dangers begin before birth. Toxic metals from e-waste can cross the placental barrier to alter fetal development. Infants born near e-waste sites face higher rates of premature birth, lower birth weights, and increased DNA damage. (International Journal of Environmental Research & Public Health, 2026).
23. Between 50% and 80% of exported e-waste is processed in high-risk, informal hubs across low- and middle-income countries (LMICs) such as China, India, Pakistan, Balngladesh, Vietnam, the Philippines, Ghana, and Nigeria. (Workplace Health & Safety, 2026).
24. In Kenya, at the Dandori dump site, lead in the soil has been reported at 4498 ppm – this is ten times higher than the EPA’s acceptable threshold of 400 ppm. (International Journal of Innovative Research & Development, 2021).
25. In Bangladesh, the country has become a net importer of e-waste, despite being a signatory to the Basel Convention and having its own national e-waste rules in place to ban such an influx (Transparency International Bangladesh, 2025).
26. Toxins don’t respect borders. Airborne particles from burning cables and acid baths in Southeast Asia’s recycling regions are carried by wind patterns across the Pearl River Delta, exposing an estimated 45 million people to dangerous chemicals. (Population Reference Bureau, 2013).
♻️ A massive circularity shortfall
With billions of dollars in gold and rare metals locked inside dead devices, you’d think we’d reclaim them with haste. But no: instead of retrieving this non-hidden treasure, our inflexible infrastructure means we’re ignoring a goldmine in plain sight. Here is the data on our curious failure to close the loop and cash-in.
27. Despite being potentially lucrative, only 22.3% of the 62 million tonnes of e-waste generated globally in 2022 was documented as properly collected and recycled. (Global E-waste Monitor, 2024).
28. We are literally throwing away billions. In 2022, the raw materials hidden inside our e-waste were valued at $91 billion – including $19 billion in copper and $15 billion in gold. Because of poor recycling, $62 billion of that was lost to dumps and incinerators. (Global E-waste Monitor, 2024).
29. As the world transitions to green energy, we need rare earth elements. Yet, e-waste recycling meets a pitiful 1% of the global demand for these crucial materials that are increasingly scarce and difficult to retrieve in their natural environment. (Global E-waste Monitor, 2024).
30. Things are actually trending backward. Because consumption is skyrocketing and product lifespans are shrinking, the global documented e-waste recycling rate is projected to drop from 22.3% to 20% by 2030. (Global E-waste Monitor, 2024).32. The financial and societal incentives to fix this profligacy is massive. If countries could bring e-waste collection and recycling rates up to 60% by 2030, the economic and health benefits would exceed the costs by more than $38 billion. (Global E-waste Monitor, 2024).
How Big is Mount Gizmo?
Our rough-and-ready methodology
To transform the world’s staggering gadget fixation into a pioneering blight on the landscape, we’re sticking to the same back-o’-envelope logic we used for its predecessors, Mount Waste – the World’s Highest Mountain – and Mount Trendy: the planet’s second highest peak. Officially.
Here, however, we won’t quite reach the same rarefied heights because while those two peaks were built from airy materials, Mt. Gizmo is constructed from a crenulated, weighty mix of motherboards, cracked screens, and hollow refrigerator chassis. We’re working with a far denser breed of filth.
Shape: As with its sibling peak, we’re picturing a classic, sharp cone.
Density: Electronic waste is denser than clothes or food but it still contains plenty of air pockets (think of the homely empty space inside a microwave or a washing machine). Based on waste management metrics, we’re using an average density of 350 kg per cubic meter for uncompacted, mixed e-waste.
The Scenario: To give us a nice, stable base for our skyscraper of scrap, we’re giving it a footprint 800m wide (a 400m radius).
The Calculation
- Total Mass: 62,000,000 tonnes (62,000,000,000 kg)
- Volume: 62,000,000,000 kg ÷ 350 kg/m³ ≈ 177,142,857 cubic meters
- Cone Volume Formula: $V = \frac{1}{3}\pi r^2 h$
- The Math: 177,142,857 = ⅓ × 3.14159 × (400²) × h
The Verdict: A Portentous Skyscrapper
So, how does Mt. Gizmo stack up? It reaches a staggering height of 1,057 meters (approximately 3,469 feet).
While it doesn’t reach the cloud-piercing altitudes of Mt. Waste or Mt. Trendy, Mt. Gizmo is a heavy-metal monolith that would instantly become the tallest freestanding structure on Earth. To put that height into perspective:
- Taller than the Burj Khalifa: At 1057m, Mt. Gizmo looks down condescendingly on Dubai’s Burj Khalifa (828m), which was the tallest building in the world.
- A true metallic titan: It is nearly three times the height of the pitiful Eiffel Tower (330m) and more than twice the height of the Empire State Building (443m). A little closer to home, it’s nearly six times the Sagrada Familia (172.5m), which reached its final height this year and is the tallest cathedral in the world.
Of course, a 900-meter-tall pile of tangled charging cables, leaking batteries, busted plasma TVs, and miscellaneous electronic smithereens, would likely suffer toxic landslides without some promethean engineering. But since we’re already imagining a world where we toss away 62 million tonnes of tech a year, without a thought, we’re sure Silicon Valley could invent an app to stabilize our towering monument (although with the periodic upgrades to the app and the need for the latest devices to run the software we’d be adding to the height slightly).
👚 The next time you need a new gadget…
Even if a fancy new gadget looks delectable – remember: the facts above make it clear that our devices are inflicting a huge stain on our world. Looking ahead, the appetite for tech isn’t subsiding but perhaps the change can start with a more mindful connection with technology.
We’ll make sure to update this article with the latest studies, stats, and research. Feel free to use these to reinforce your story – wherever you’re telling it. And remember, facts alone aren’t enough to shape a convincing narrative. If you’re a better kind of tech brand, about to tell the world about your mission, why not introduce yourself? We’ve supported businesses of all sizes to tell their stories and sustainable fashion is one of the key sectors we carve out success in.


Leave a Reply