
When marketing sustainability, how do you get your message to stand out like a fantastically coloured fungus in a market where wordsmiths are aplenty and tools like ChatGPT are giving everyone a chance to craft competent blog posts and slick social media updates? Any ideas?
Well, developing infographics is one of the best things you can do to cut through the clutter. Great words and clever visualizations, together, are a far rarer and more impressive skill than words alone. It’s not just about one or the other – it’s about finding that amazing mix.
Here are six key reasons why you should be developing infographics and data visualization as part of your sustainability marketing strategy.
Sustainability suits visualization
Sustainability is a data-heavy field. Metrics like carbon footprints, energy reduction percentages, water consumption stats, and species on the verge of extinction are at the heart of your marketing tales. While these facts and figures pack plenty of persuasive power, they tend to lose their punch when presented as blocks of text. Even the cleverest epigrammatic social updates aren’t quite enough to hit through.
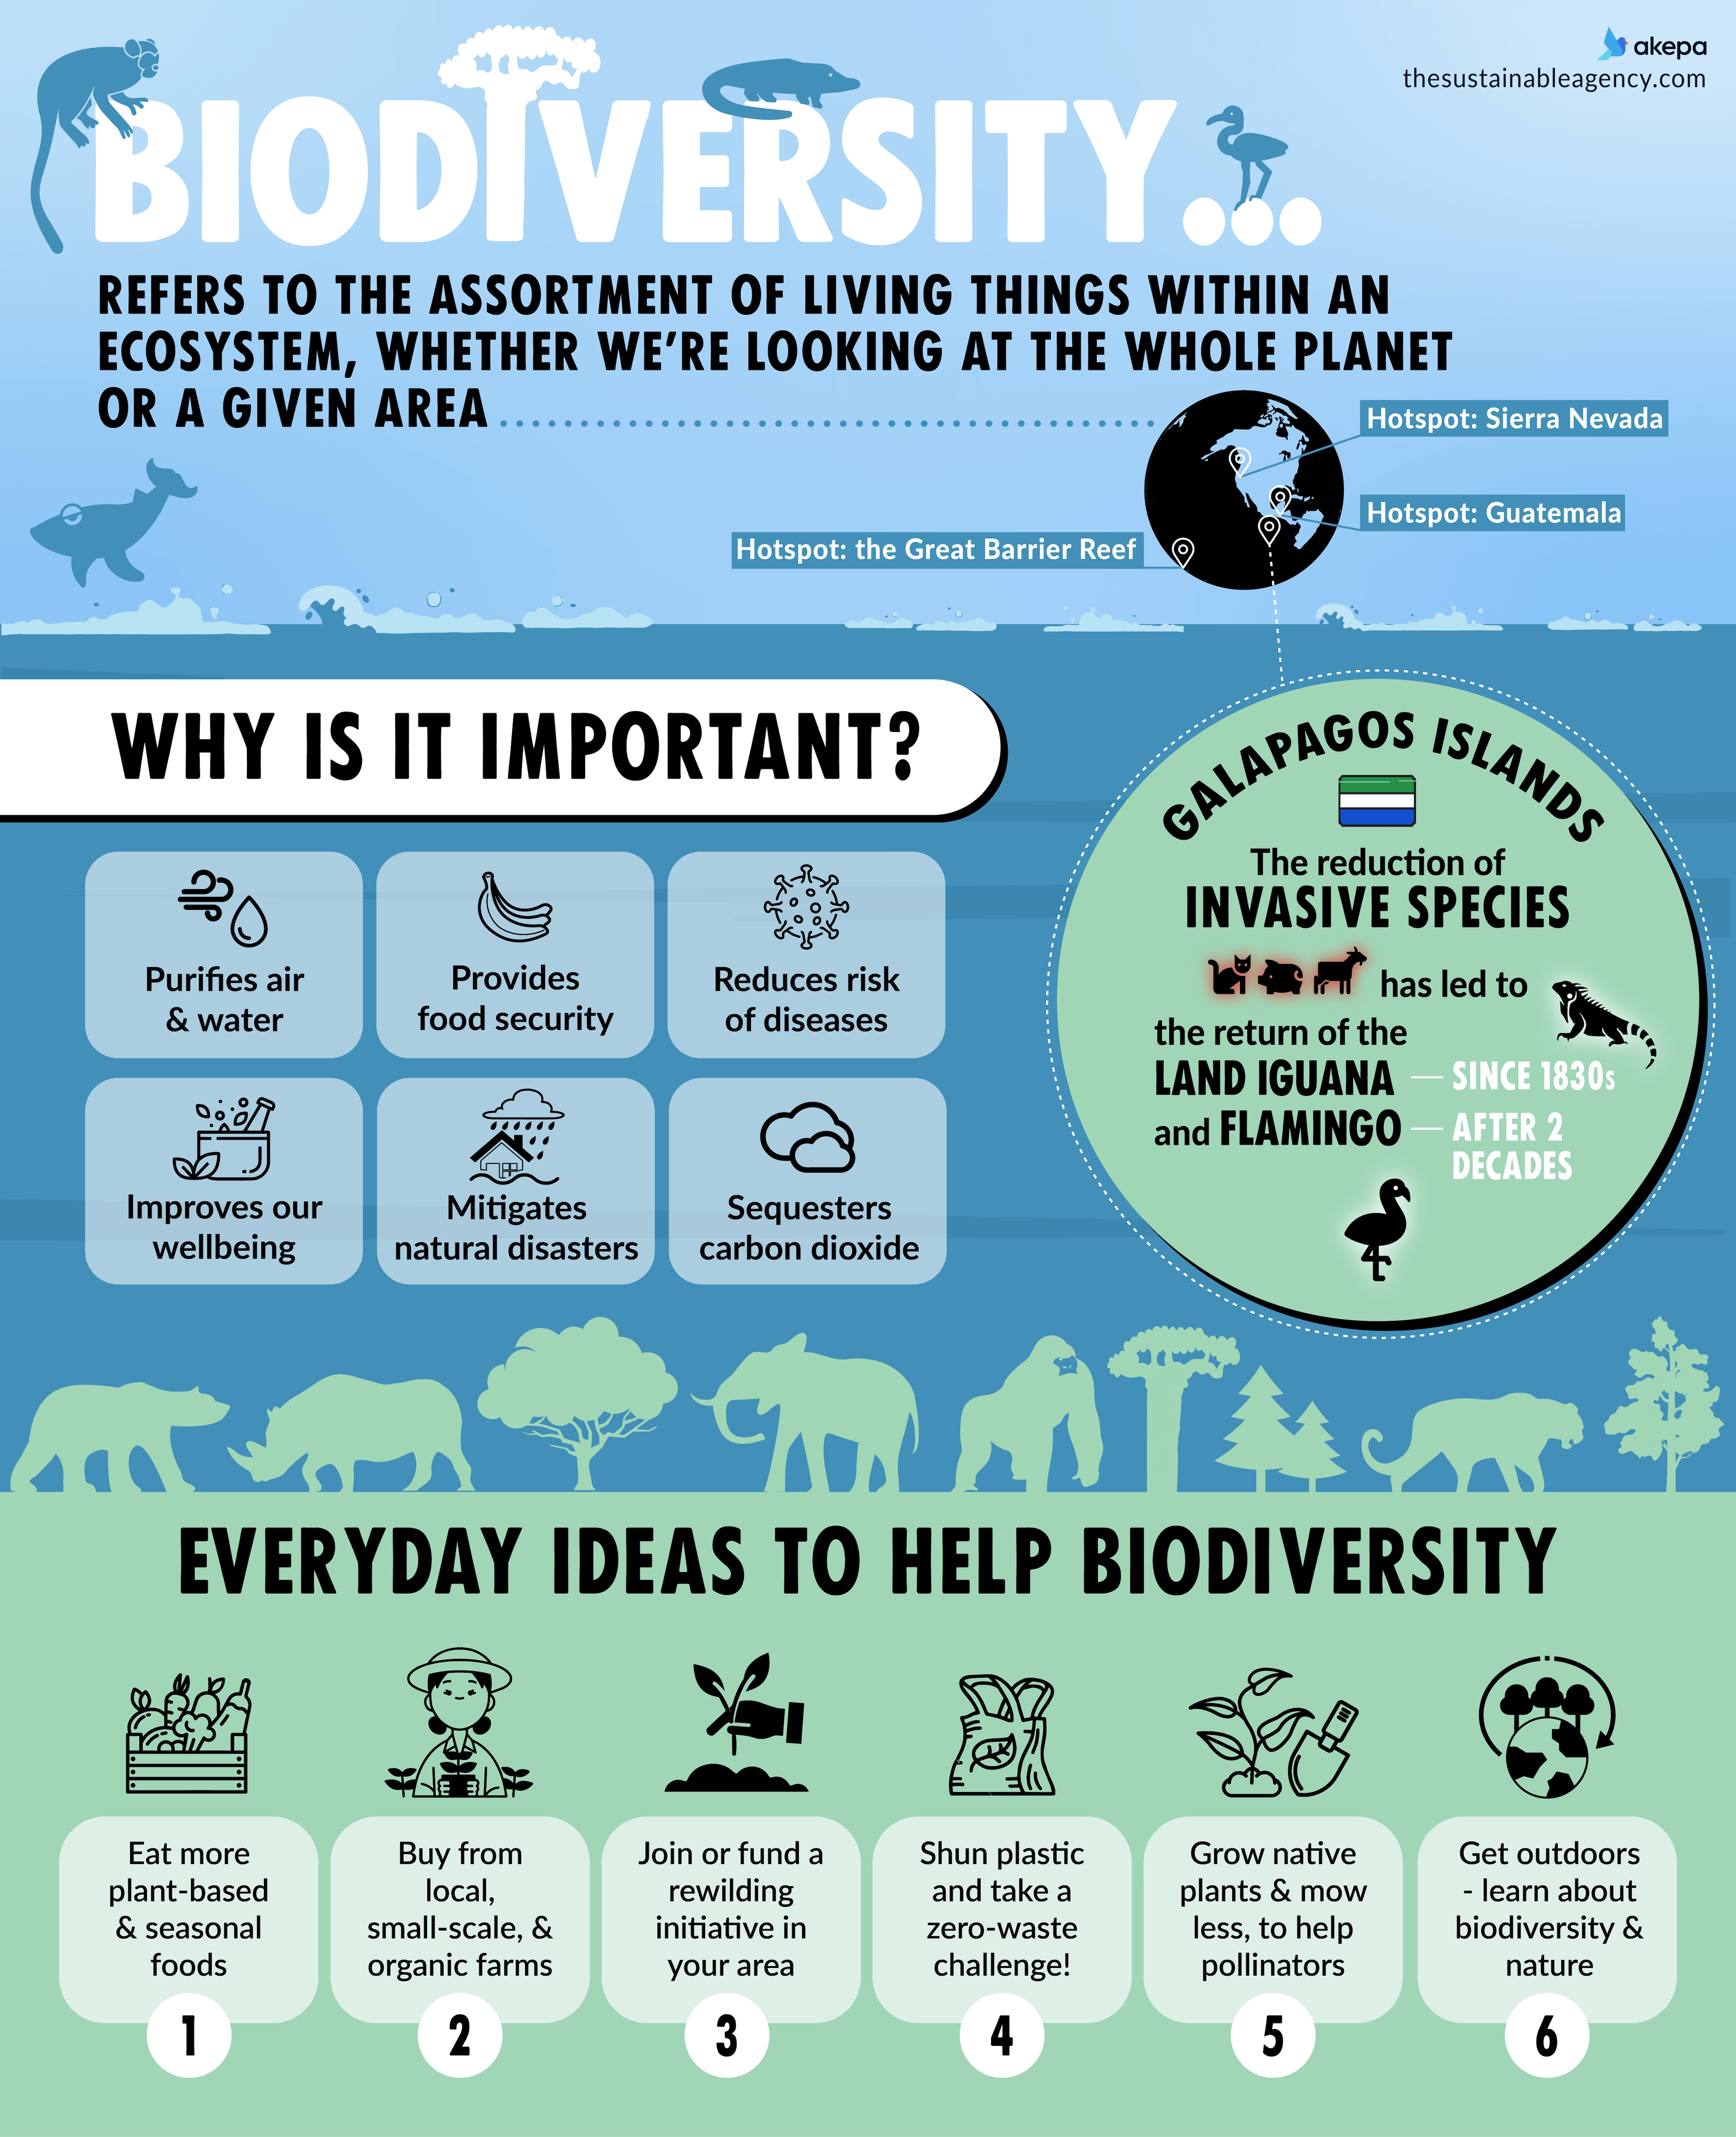
That’s where infographics can elevate your storytelling. A mesmerizing chart or a colorful allegorical diagram does the heavy lifting of turning BORING data into something fun, which equals engaging. For instance, wouldn’t you rather look at a social media iceberg rather than some bloke ranting on about how sustainability is ‘multifaceted’?
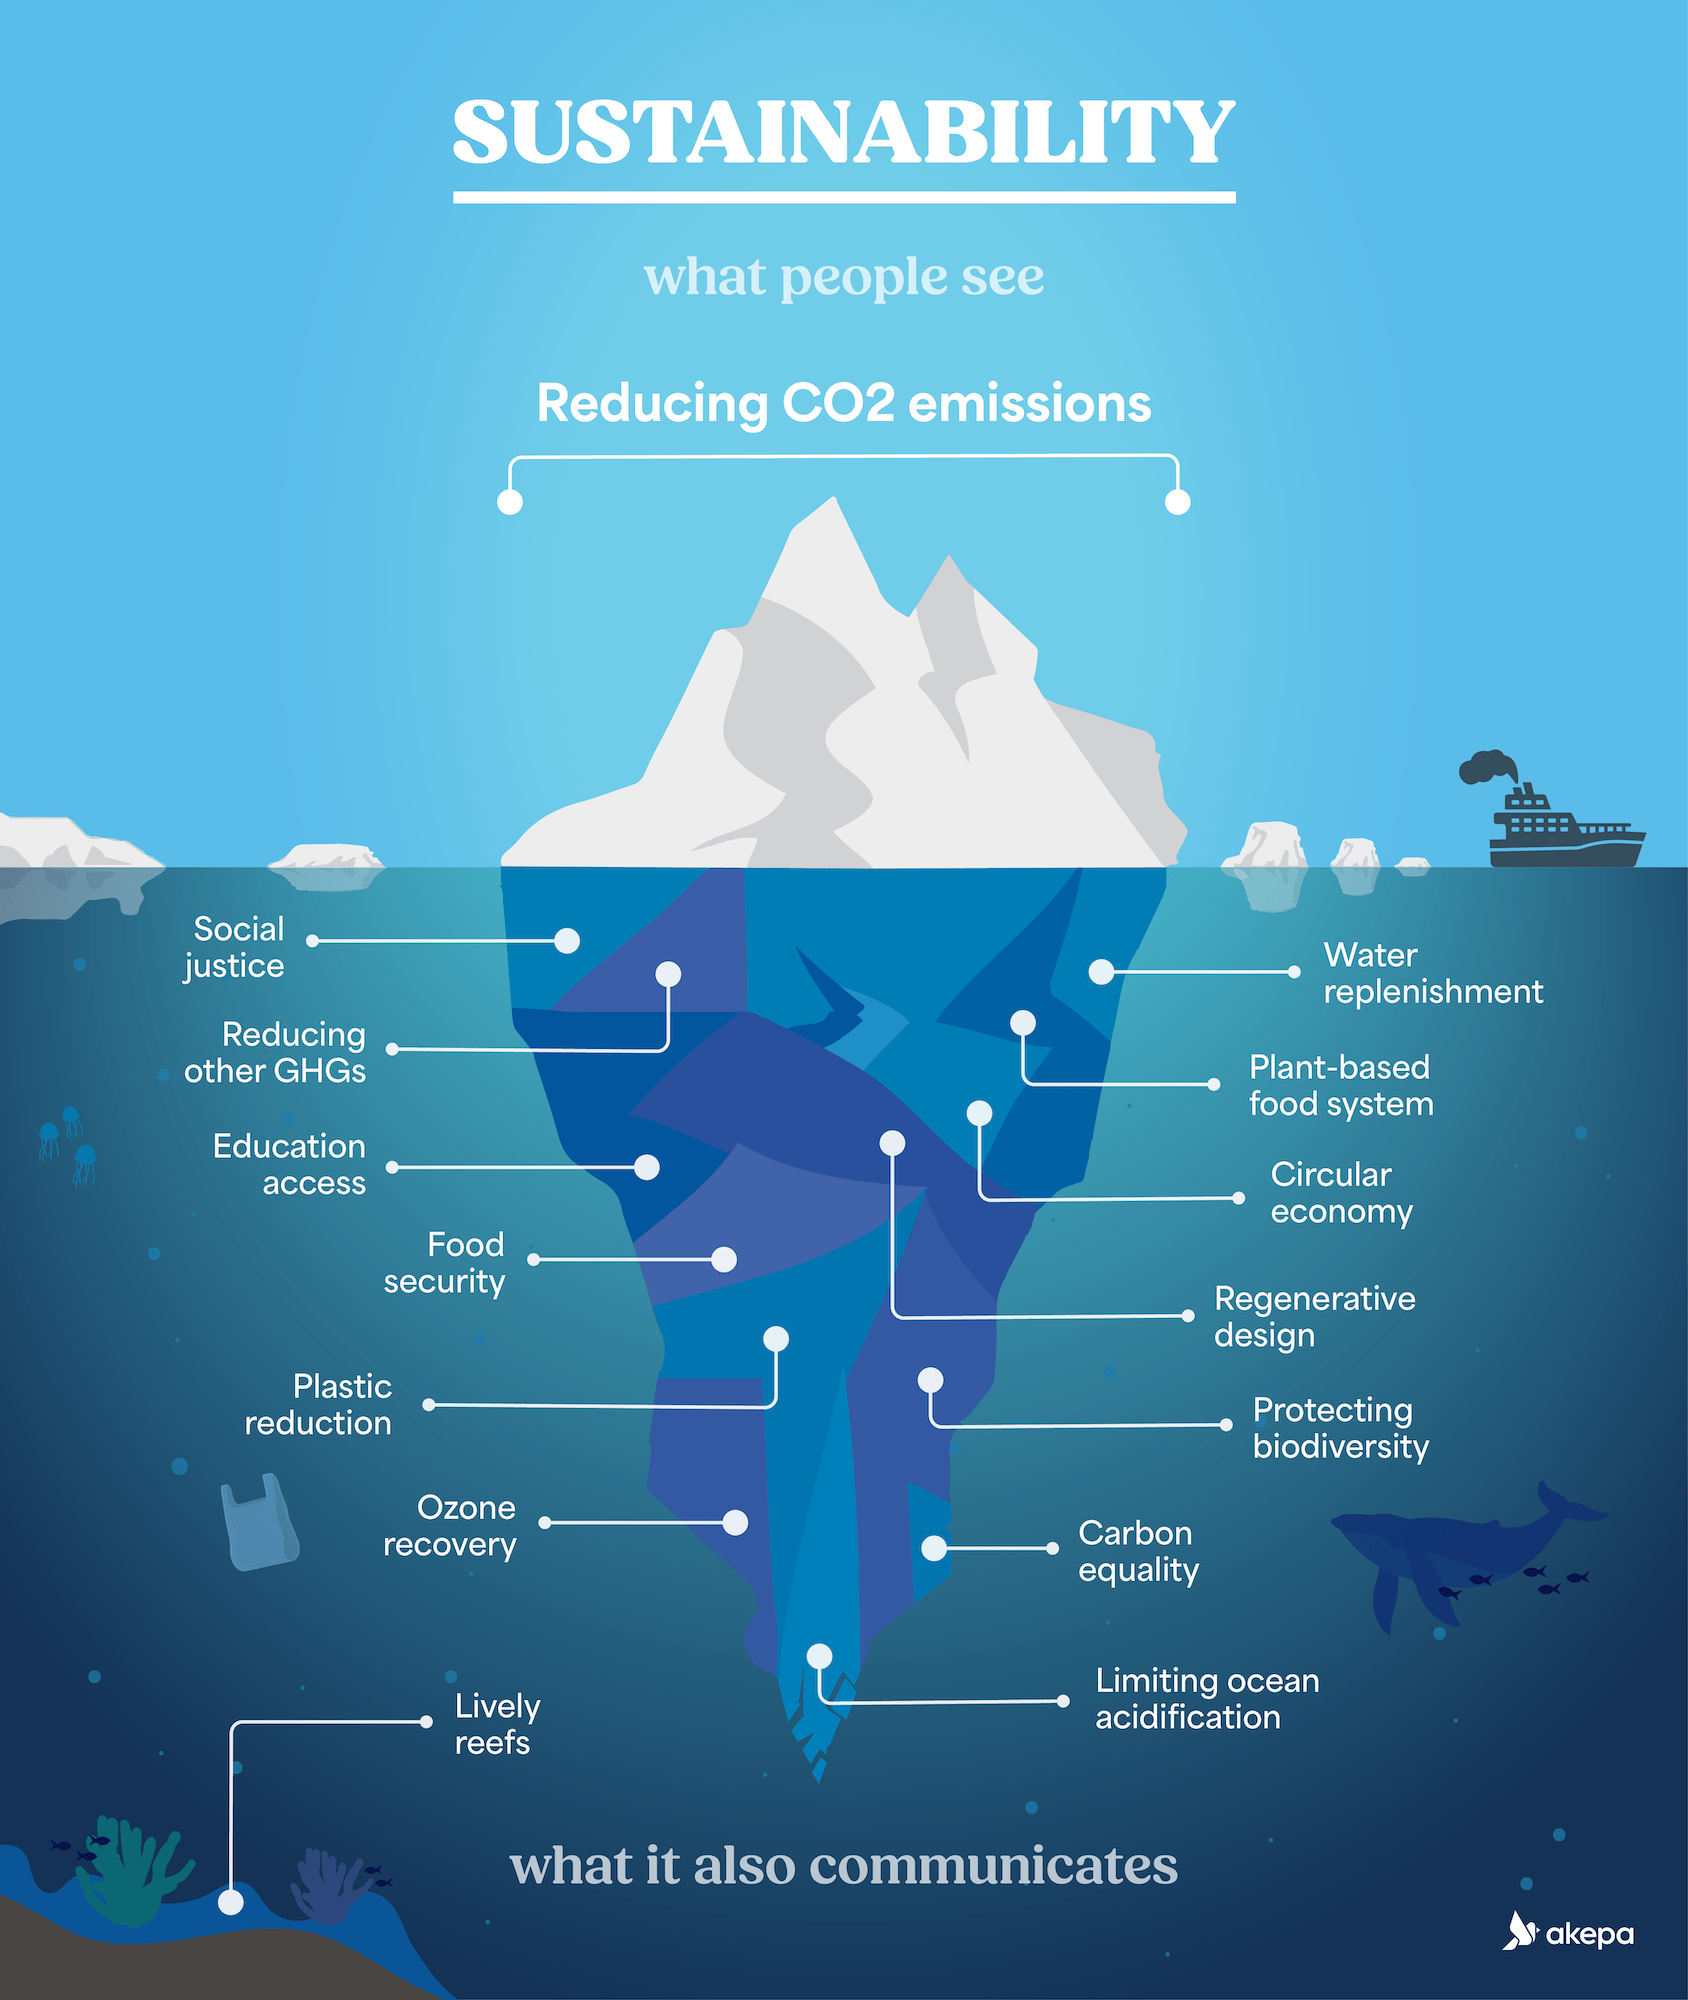
Infographics make cold information more charming while making your message easier to understand. And, importantly, they strike a balance between logic and emotion. Visual representations of environmental impacts, for example, can be as intellectually nutritious as they are emotionally stirring, moving your audience a little closer; growing that gravity between you and them.
For sustainability marketers, this is tops. When you offer clarity amid complexity, your credibility grows. And trust is key when your goal is convincing folk, investors, or businesses to care about something as careful as sustainability.
Everyone can write now!
Here’s the uncomfortable truth that is giving some marketeers existential horrors: writing isn’t the barrier to entry it used to be. With tools like ChatGPT helping even non-writers produce adequate content, the written word alone is no longer enough to set your brand apart.
Your audience is getting bombarded with words to the point where they’re zipping past, too blurry to read. From LinkedIn posts to blog articles, words are everywhere, and while they remain important, they’re no longer scarce. Infographics, on the other hand, occupy a sweet spot. Not everyone has the skills (or time) to craft a truly great infographic. Add sustainability into the equation and the pool of capable creators shrinks even further. You’re now looking at a puddle.
This makes infographics a powerful new eye-catching plumage. They invite your audience to pause and engage in ways text rarely does these days. A well-constructed infographic doesn’t just deliver information; it makes your message more memorable. People process visual content much faster than text, and they’re more likely to retain those visual impressions long after they’ve scrolled away.
By blending smart copywriting with brilliant design, you push your brand above a sea of “meh” content. You’re now a fancy looking parrot and your competitors are brownish sparrows.
Social media algorithms reward infographics
The days of unfiltered organic social media reach have long passed. Platforms like Instagram, X (or Twitter, if you’re nostalgic), and LinkedIn increasingly prioritize content types that engage users quickly and keep them scrolling. Guess which format does that exceptionally well?
That’s right, infographics. They stop fidgety FOMO thumbs mid-scroll. They inspire shares, likes, and saves in ways Phil-Spector-ish walls of text rarely can. For sustainability topics, they can simplify or spotlight pressing issues that your audience has deep feelings about. Visual stats like “50% of landfill waste is recyclable” or “30% of the planet’s CO2 is absorbed by oceans, mainly from phytoplankton” pack a spicy punch when paired with compelling design.
When your content gets more engagement, the algorithms notice and reward it by showing it to more people. Infographics don’t just boost audience interaction; they help you beat the algorithmic black hole that many plain-text posts get sucked into.
“If you stare long enough into the abyss, then the abyss looks back” as Nietschze said – although we’re not quite sure how that applies to infographics.
Anyway, another bonus? Infographics are versatile across platforms. Long-form visuals can be chunked into bite-sized pieces for Instagram carousels or reconstructed into quick Twitter graphics. What you actually have in your palms is a single piece of visual content that can be recycled across multiple channels, each tailored to fit its platform. There’s probably even a tenuous environmental argument here.
Improved SEO & content marketing
A likeable sustainability marketing strategy doesn’t just carouse on social media; it needs a stable base, such as your website or blog. This is where your SEO skills come into play.
Infographics attract backlinks like flies to fly agaric mushrooms. When people find your sustainability data well-presented in a concise visual format, they’ll link back to it in their own content. These backlinks can boost your site’s SEO rankings, making it easier for people to find your brand when searching for terms like “sustainability infographics”, which may or may not be one of the terms we’re targeting with this post and is searched for 1,000 times per month – according to Google’s Keyword Planner.

Still, it’s not just about backlinks. Infographics also help your on-page SEO. By embedding keyword-rich alt text, thoughtful page titles, and so on, to complement your visual content, you can make your pages pre-eminent on search engines. Google Image Search, for example.
Plus, infographics keep users on your site longer. If someone lands on your blog and finds a periodic table of sustainability certifications, instead of a long list, they’re more likely to dig in. Some say Google notices this behavior too; longer site visits signal quality content.
Building your brand
Sustainability and branding go hand-in-hand, especially as folks demand transparency and sincere green practices from businesses. An exceptional infographic is more than just luxury data; it reflects the values and visual identity of your brand.
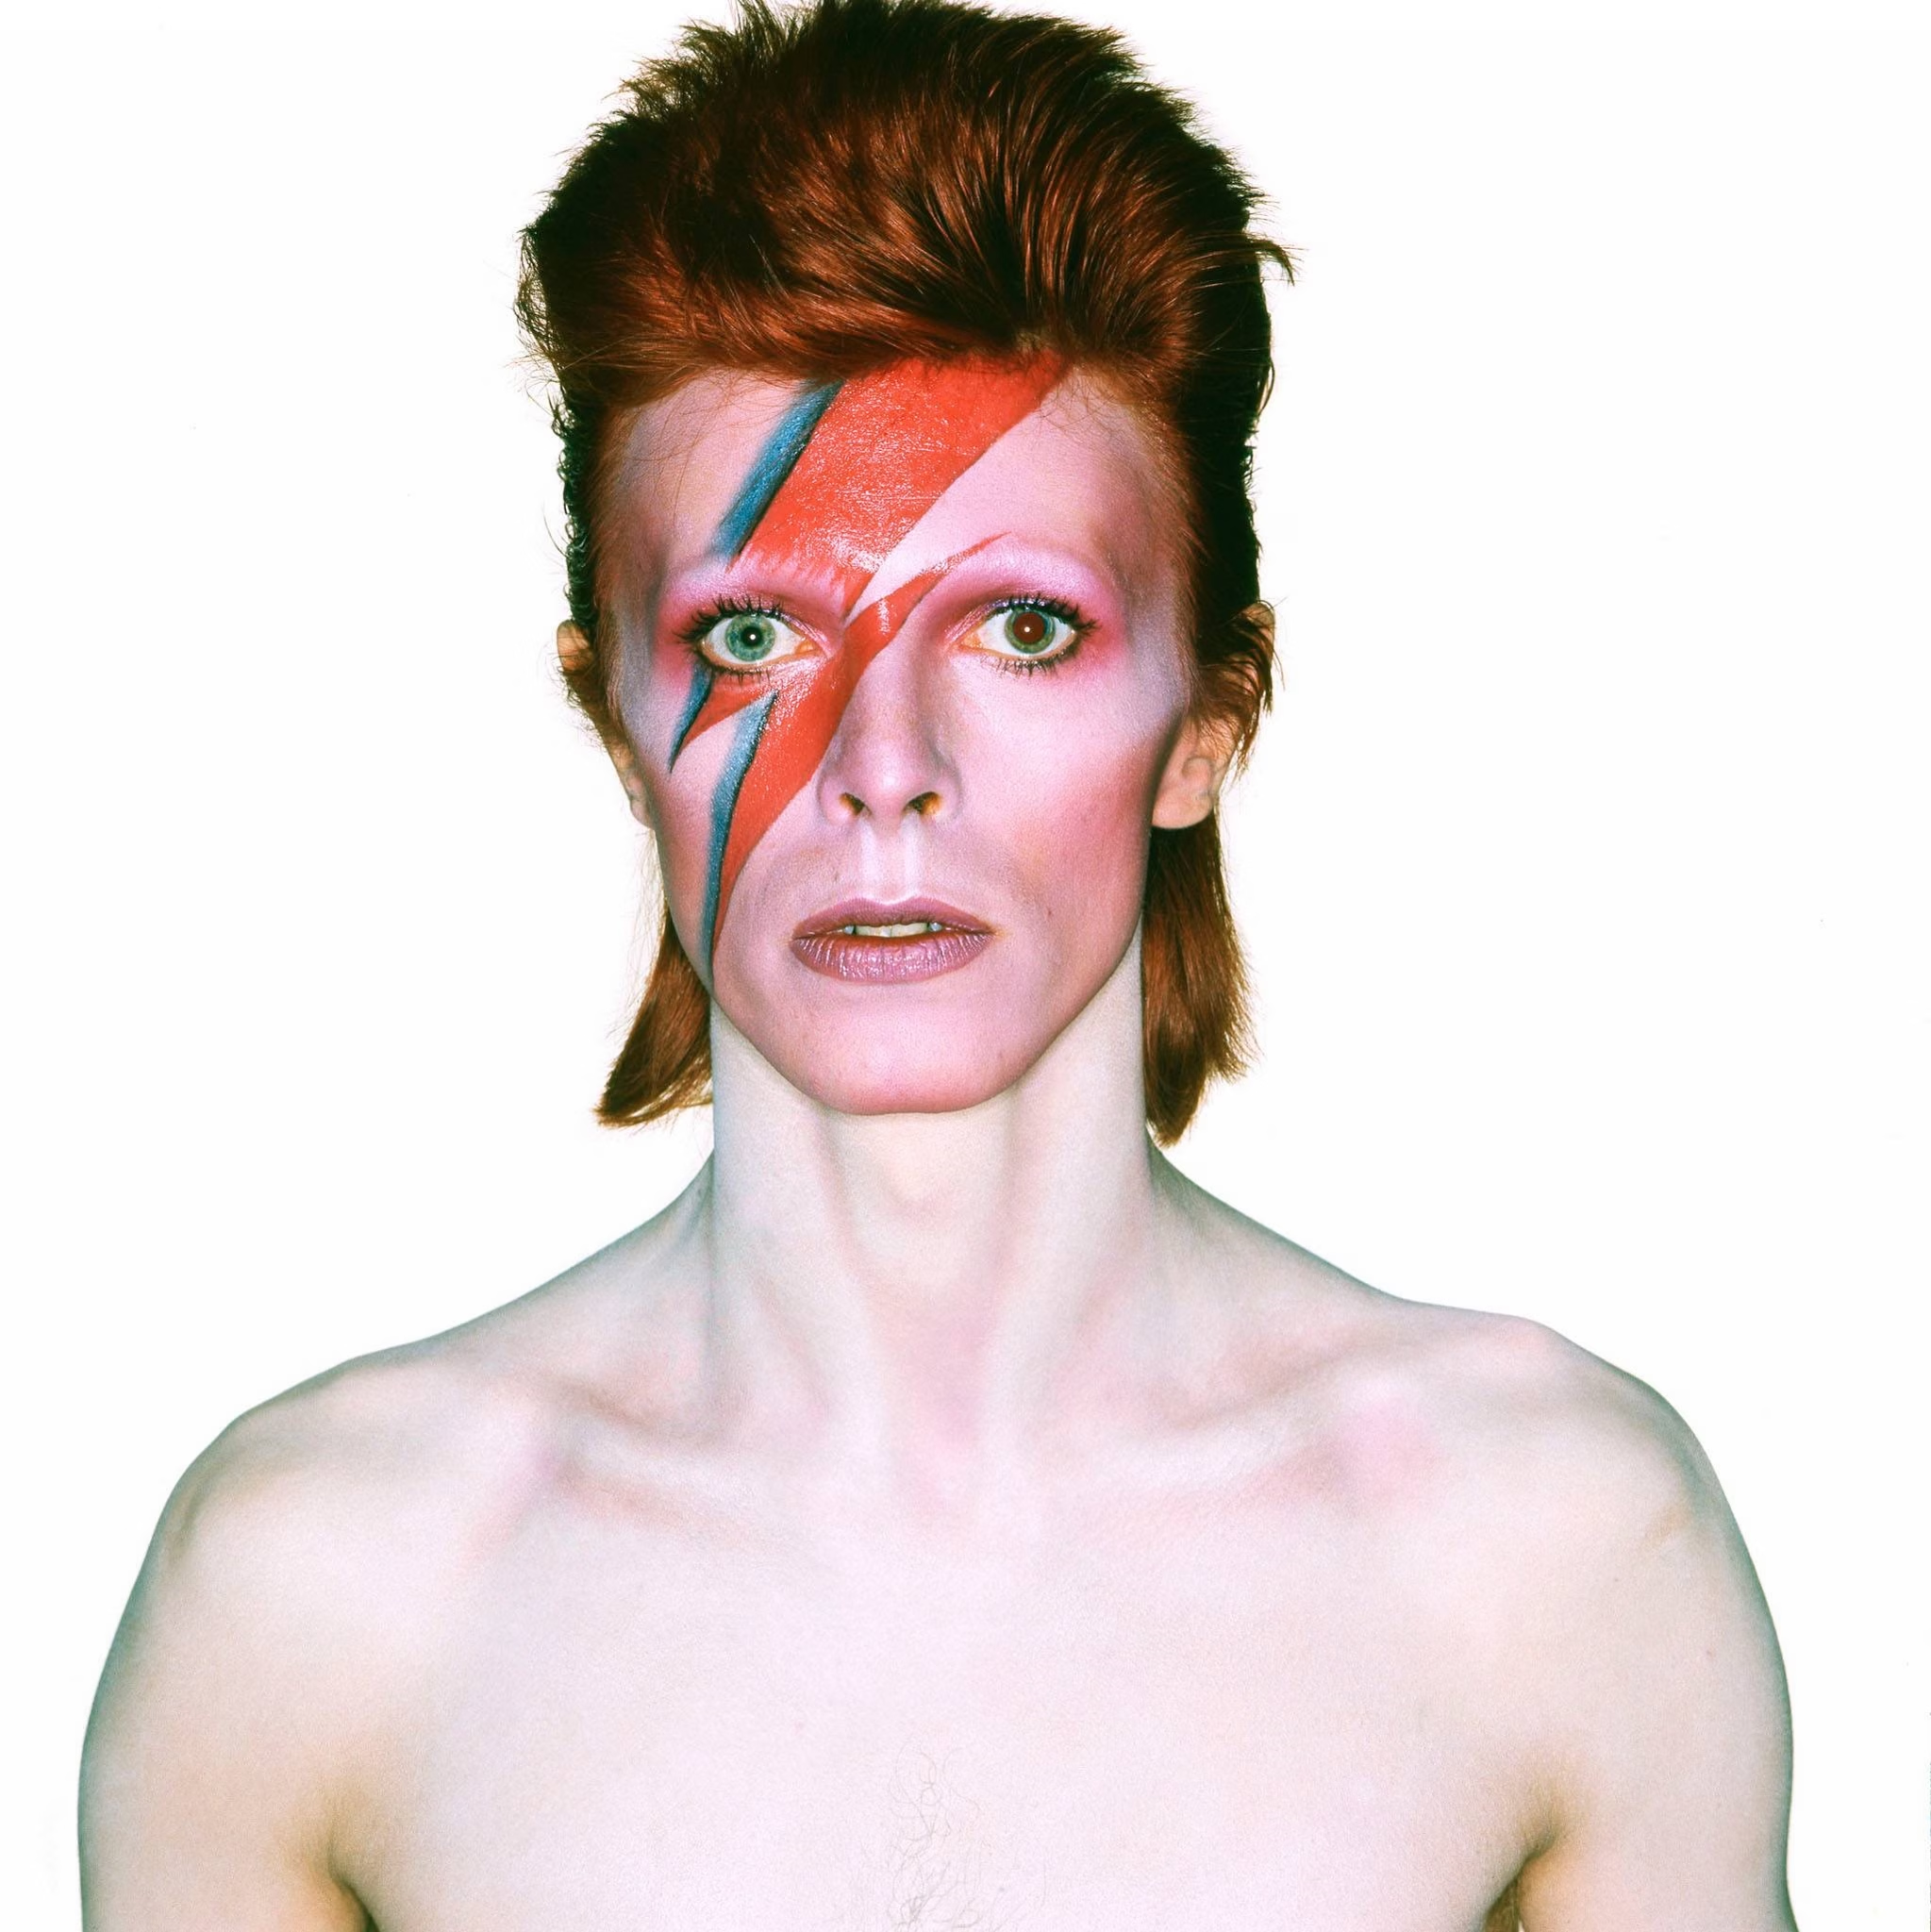
Your audience doesn’t just buy into sustainability; they buy into your refraction of it. Whether you’re a corporate giant striving for net-zero emissions or a scrappy startup producing vegan cheese, visual storytelling acts like the sartorial details that distinguish David Bowie from David Hasselhoff. Infographics allow you to showcase your unique sustainability style.
Our infographics are a conduit of our non-preachy, humorous and – at times – vaguely nihilistic approach to sustainability which is absolutely not about banging on about ‘saving the planet’, for example.
Consistency is crucial here. Beautifully designed infographics that incorporate your brand’s colors, fonts, logo, and tone of voice create a cohesive look across all platforms. Over time, this builds the brand. People should recognize your sustainability visuals at a glance, whether they stumble across them on LinkedIn, your website, or in a newsletter.
And don’t overlook the emotional connection of a good infographic. A powerful visual story about deforestation or an uplifting one about a rewilding success can leave a lingering emotional impact, turning casual followers into big fans of your brand.
Beyond pretty pictures: Infographics as brouhaha
While the five points above cover the key benefits, there’s one underrated advantage to infographics in sustainability marketing. They don’t just inform, like a didactic schoolteacher; they get conversation going.
A thought-provoking, data-packed visual can get your audience talking. It can nudge a journalist to cite your work, motivate a social media user to tag their friends, or even inspire another brand to collaborate with you. Put simply, infographics open doors to engagement that extend beyond the initial ‘like.’
When your sustainability marketing ignites a bit of brouhaha, it turns into a movement—even if it’s just a small one. It’s conversations like this that build communities, and when tackling issues as colossal as climate change, biodiversity loss or plastic reduction, community-building is a fine thing.
You could say it’s just about standing out
Sustainability marketing is filled with challenges. You need to educate, inspire, amuse, and maybe even piss someone off. Doing so with nothing more than text increasingly feels like trying to wrest plastic from the ocean using a makeshift fishing rod, with a corn-on-cob as bait. Infographics, on the other hand, are the premium tools that can help you make a real impact.
In the end, infographics make your sustainability story that bit more of a page turner. They make your brand easier to notice, remember, and trust.
And isn’t that what good marketing is all about?

Leave a Reply